
Down 30% Since Pre-Covid High, Is Cracker Barrel Stock A Buy?
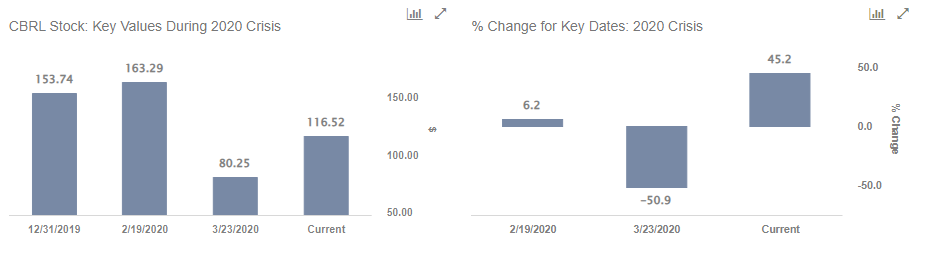
We believe that Cracker Barrel Old Country Store stock (NASDAQ: CBRL), an American chain of restaurant and gift stores with a Southern country theme, is a good buying opportunity at the present time. CBRL stock trades near $117 currently and it is, in fact, down 31% from its pre-Covid high of around $169 in Feb 2020 – before the coronavirus pandemic hit the world. CBRL stock has had a volatile ride since early 2020 as restaurants were shut down across the country, and it took months for them to start getting some of that revenue back. Further, the restaurant industry was also grappling with inflation and staffing challenges of late. While the company’s stock rallied 45% from levels of around $80 seen in March 2020, when broader markets made the bottom, to levels of around $117 currently – CBRL stock saw subdued performance compared to the overall market. Thus, the company’s stock still seems attractive at the current price.
Compared to Q1 FY 2020, comparable store restaurant sales increased 1.4% and comparable store retail sales increased 17.6% in the recent Q1 FY 2022. Both comps showed a positive recovery trend, and to add to this the company’s comparable-store off-premise sales increased 168% (compared to pre-pandemic level), coming in at 20% of restaurant sales. This strength in off-premise even as dine-in traffic has increased is quite encouraging, suggesting an incremental growth opportunity – if the company can maintain these volumes. In the upcoming holiday quarter (FY Q2 2022), CBRL’s comparable store restaurant sales growth is expected to be higher as compared to Q2 FY 2020, and the adjusted operating margin is expected to range between 5.5% and 6.0% of revenue.
While CBRL stock has been volatile in the current Covid-19 crisis, how did it fare in the 2008 crisis? In this note, we focus on a comparative analysis of Cracker Barrel Old Country Store stock upside post Covid in an interactive dashboard analysis.
Timeline of Covid-19 Crisis So Far:
- 12/12/2019: Coronavirus cases first reported in China
- 1/31/2020: WHO declares a global health emergency.
- 2/19/2020: Signs of effective containment in China and hopes of monetary easing by major central banks helps S&P 500 reach a record high
- 3/23/2020: S&P 500 drops 34% from the peak level seen on Feb 19, 2020, as COVID-19 cases accelerate outside China. Doesn’t help that oil prices crash in mid-March amid Saudi-led price war
- Since 3/24/2020: S&P 500 recovers 93% from the lows seen on Mar 23, 2020, with the Fed’s multi-billion dollar stimulus package keeping the economy afloat during the prolonged lockdown and the vaccination drive allowing things to gradually return to near-normal conditions despite several waves of Covid infections.
- 01/25/2022: 63% of the U.S. population is fully vaccinated for Covid-19.
In contrast, here is how CBRL stock and the broader market fared during the 2007-08 crisis
Timeline of 2007-08 Crisis
- 10/1/2007: Approximate pre-crisis peak in S&P 500 index
- 9/1/2008 – 10/1/2008: Accelerated market decline corresponding to Lehman bankruptcy filing (9/15/08)
- 3/1/2009: Approximate bottoming out of S&P 500 index
- 12/31/2009: Initial recovery to levels before accelerated decline (around 9/1/2008)
CBRL and S&P 500 Performance Over 2007-08 Financial Crisis
CBRL stock declined from levels of about $42 in October 2007 (pre-crisis peak for the broader markets) to levels of around $26 in September 2008 and further fell to $22 in March 2009 (as the markets bottomed out), implying CBRL stock declined 47% from its October 2007 levels. Furthermore, it rallied to levels of around $38 by the end of 2009, reflecting a 70% growth from its bottom. In comparison, the S&P 500 Index saw a decline of 51% from its peak in September 2007 to its bottom in March 2009, followed by a sharp recovery of 48% by January 2010.
CBRL Fundamentals Over The Recent Years
CBRL’s revenues have remained flat at $3 billion over the last twelve-month and since 2018. The company’s earnings per share expanded slightly to $10.74 in 2021, compared to $10.31 in 2018.
Does Cracker Barrel Old Country Store Have Sufficient Cash Cushion To Meet Its Obligations?
CBRL has seen its total debt decline to $377 million in Q1 fiscal 2022, compared to $400 million in FY 2018, and its total cash increased 10% to $126 million from $115 million over the same period. Despite the impact of the pandemic, the company generated strong cash flow in the last twelve months with cash from operations at approximately 74% of its pre-pandemic levels – given that many big restaurant brands have been running on minimal cash in recent years in a race to open new locations. A stronger balance sheet, and improving cash flows, positions the company to invest in the growth of its business while returning capital to shareholders. In this regard, CBRL announced a quarterly dividend of $1.30 per share, which matches its pre-pandemic dividend level, but on a lower base of earnings.
Conclusion
Phases of Covid-19 crisis:
- Early- to mid-March 2020: Fear of the coronavirus outbreak spreading rapidly translates into reality, with the number of cases accelerating globally
- Late-March 2020 onward: Social distancing measures + lockdowns
- April 2020: Fed stimulus suppresses near-term survival anxiety
- May-September 2020: Recovery of demand, with the phased lifting of lockdowns – no panic anymore with number of cases appearing to have plateaued
- October 2020-February 2021: Unprecedented surge in Covid cases forcing a fresh round of lockdowns across the nation
- Since March 2021: Ongoing vaccination drive and gradual re-openings drive an improvement in demand – buoying market sentiment
Despite the recent rise in the number of new Covid-19 cases in the U.S., we expect an improvement in demand to buoy market expectations. We believe CBRL stock has the potential for some gains once fears surrounding the Covid outbreak are put to rest.
| Jan 2022 MTD [1] |
2022 YTD [1] |
2017-22 Total [2] |
|
| CBRL Return | -9% | -9% | -30% |
| S&P 500 Return | -7% | -7% | 98% |
| Trefis MS Portfolio Return | -11% | -11% | 248% |
[1] Month-to-date and year-to-date as of 1/31/2022
[2] Cumulative total returns since the end of 2016