How Will Casey’s Stock React To Its Upcoming Earnings?

Casey’s General Stores (NASDAQ: CASY), a gas station and convenience store chain, is set to report its fiscal first-quarter earnings (April year) on Monday, September 8, 2025. Analysts expect EPS of $5.06 on $4.48 billion in revenue, representing a 4% year-over-year increase in earnings and a 9% rise in sales compared with last year’s $4.86 per share on $4.10 billion in revenue. Historically, CASY stock has fallen 60% of the time following earnings, with a median one-day decline of 2.7% and a maximum drop of 7%.
For the full year 2025, Casey’s posted EPS of $14.64 and EBITDA of $1.2 billion, alongside a record 270-store expansion. The company increased its dividend 14% to $0.57 per share. It provided FY2026 guidance of 10%–12% EBITDA growth, 2%–5% same-store inside sales growth, and stable fuel gallons sold, underscoring strong financial performance and ongoing strategic growth.
The company has $18 Bil in current market capitalization. Revenue over the last twelve months was $16 Bil, and it was operationally profitable with $796 Mil in operating profits and net income of $547 Mil. While a lot will depend on how results stack up against consensus and expectations, understanding historical patterns might turn the odds in your favor if you are an event-driven trader. Separately, see Buy Meta over Amazon?
For event-driven traders, historical patterns may offer an edge, whether by positioning ahead of earnings or reacting to post-release moves. That said, if you seek upside with lower volatility than from individual stocks, the Trefis High Quality portfolio presents an alternative, having outperformed the S&P 500 and generated returns exceeding 91% since its inception. See earnings reaction history of all stocks.
- RH Stock: Strong Cash Flow Poised for a Re-Rating?
- Intuitive Surgical Stock at Support Zone – Bargain or Trap?
- Tractor Supply Stock Hits Key Support – Buying Opportunity?
- What Is Happening With Phillips 66 Stock?
- Is T-Mobile US Stock an Under-Analyzed Capital Compounder Opportunity?
- Structural Risks to Watch For AMD Stock Over the Next 6 Months

Photo by AlbanyColley on Pixabay
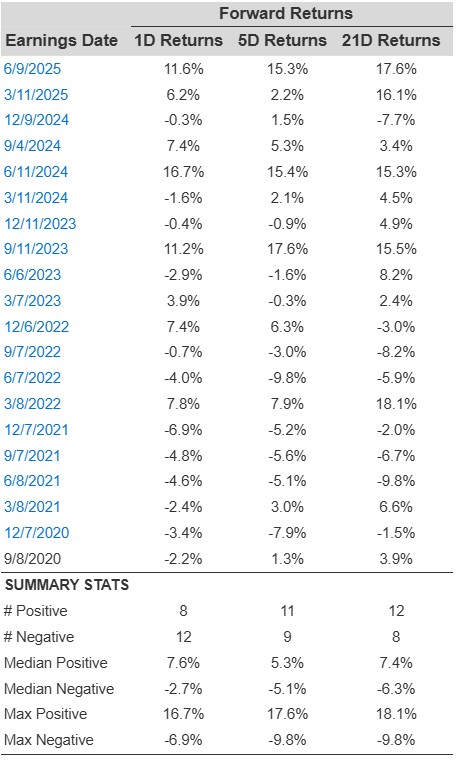
Casey’s General Stores Historical Odds Of Positive Post-Earnings Return
Some observations on one-day (1D) post-earnings returns:
- There are 20 earnings data points recorded over the last five years, with 8 positive and 12 negative one-day (1D) returns observed. In summary, positive 1D returns were seen about 40% of the time.
- Notably, this percentage increases to 58% if we consider data for the last 3 years instead of 5.
- Median of the 8 positive returns = 7.6%, and median of the 12 negative returns = -2.7%
Additional data for observed 5-Day (5D) and 21-Day (21D) returns post earnings are summarized along with the statistics in the table below.
CASY Corelation Between 1D, 5D, and 21D Forward Returns
Correlation Between 1D, 5D, and 21D Historical Returns
A relatively less risky strategy (though not useful if the correlation is low) is to understand the correlation between short-term and medium-term returns post earnings, find a pair that has the highest correlation, and execute the appropriate trade. For example, if 1D and 5D show the highest correlation, a trader can position themselves “long” for the next 5 days if 1D post-earnings return is positive. Here is some correlation data based on 5-year and 3-year (more recent) history. Note that the correlation 1D_5D refers to the correlation between 1D post-earnings returns and subsequent 5D returns.
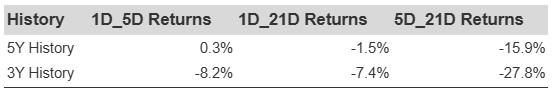
CASY Correlation Between 1D, 5D and 21D Historical Returns
Is There Any Correlation With Peer Earnings?
Sometimes, peer performance can have influence on post-earnings stock reaction. In fact, the pricing-in might begin before the earnings are announced. Here is some historical data on the past post-earnings performance of Casey’s General Stores stock compared with the stock performance of peers that reported earnings just before Casey’s General Stores. For fair comparison, peer stock returns also represent post-earnings one-day (1D) returns.
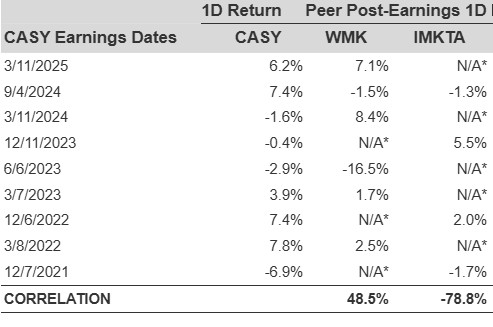
Correlation With Peers
Learn more about Trefis RV strategy that has outperformed its all-cap stocks benchmark (combination of all 3, the S&P 500, S&P mid-cap, and Russell 2000), to produce strong returns for investors.
Invest with Trefis Market-Beating Portfolios