How Will Casey’s Stock React To Its Upcoming Earnings?

Casey’s General Stores (NASDAQ: CASY), a gas station and convenience store chain, is scheduled to release its fiscal fourth-quarter earnings (April year) on Monday, June 9, 2025, with analysts projecting earnings of $1.95 per share on $3.95 billion in revenue. This would represent a 17% year-over-year decline in earnings and a 10% increase in sales compared to the prior year’s figures of $2.35 per share and $3.60 billion in revenue. Historically, CASY stock has declined 65% of the time following earnings announcements, with a median one-day drop of 2.9% and a maximum observed decline of 7%.
In the third quarter, Casey’s reported an 11% year-over-year increase in EBITDA and projected similar growth for the full year. Although net income remained flat, it would have risen 15%, excluding one-time costs from the $1.1 billion acquisition of Fikes Wholesale and its 198 stores. This performance highlights Casey’s strong profitability amid the integration of one of the largest acquisitions in its history. The company has $17 Bil in current market capitalization. Revenue over the last twelve months was $16 Bil, and it was operationally profitable with $768 Mil in operating profits and net income of $535 Mil.
For event-driven traders, historical patterns may offer an edge, whether by positioning ahead of earnings or reacting to post-release moves. That said, if you seek upside with lower volatility than from individual stocks, the Trefis High Quality portfolio presents an alternative, having outperformed the S&P 500 and generated returns exceeding 91% since its inception. See earnings reaction history of all stocks.

Photo by AlbanyColley on Pixabay
- KWEB’s History Has A Warning For Dip Buyers
- The Real Engine Behind Apple Stock’s Next Potential Climb
- Mastercard Stock And The Number Behind The Worry
- Worried About Amazon’s AI Bill? What If It’s Already Paid For?
- Caterpillar’s Margin Problem: Is the Core Business Losing Steam?
- The $50B Plan Merck Stock Was Broadcasting
Casey’s General Stores Historical Odds Of Positive Post-Earnings Return
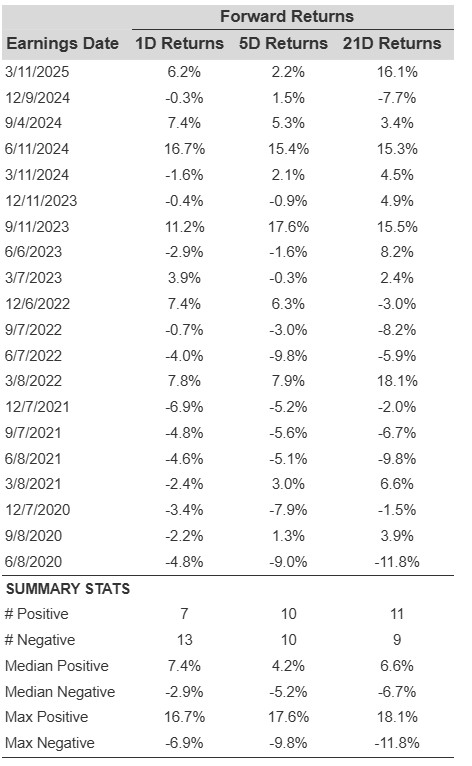
Some observations on one-day (1D) post-earnings returns:
- There are 20 earnings data points recorded over the last five years, with 7 positive and 13 negative one-day (1D) returns observed. In summary, positive 1D returns were seen about 35% of the time.
- Notably, this percentage increases to 50% if we consider data for the last 3 years instead of 5.
- Median of the 7 positive returns = 7.4%, and median of the 13 negative returns = -2.9%
Additional data for observed 5-Day (5D), and 21-Day (21D) returns post earnings are summarized along with the statistics in the table below.
Correlation Between 1D, 5D, and 21D Historical Returns
A relatively less risky strategy (though not useful if the correlation is low) is to understand the correlation between short-term and medium-term returns post earnings, find a pair that has the highest correlation, and execute the appropriate trade. For example, if 1D and 5D show the highest correlation, a trader can position themselves “long” for the next 5 days if 1D post-earnings return is positive. Here is some correlation data based on 5-year and 3-year (more recent) history. Note that the correlation 1D_5D refers to the correlation between 1D post-earnings returns and subsequent 5D returns.
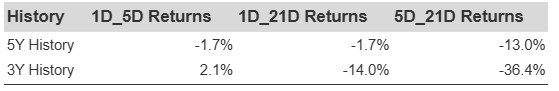
CASY Correlation Between 1D, 5D and 21D Historical Returns
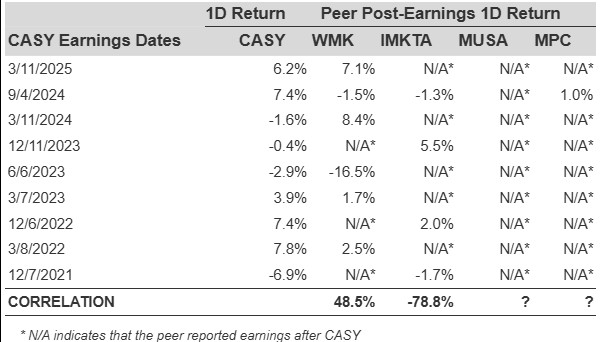
Is There Any Correlation With Peer Earnings?
Sometimes, peer performance can have influence on post-earnings stock reaction. In fact, the pricing-in might begin before the earnings are announced. Here is some historical data on the past post-earnings performance of Casey’s General Stores stock compared with the stock performance of peers that reported earnings just before Casey’s General Stores. For fair comparison, peer stock returns also represent post-earnings one-day (1D) returns.
Learn more about Trefis RV strategy that has outperformed its all-cap stocks benchmark (combination of all 3, the S&P 500, S&P mid-cap, and Russell 2000), to produce strong returns for investors.
Invest with Trefis Market-Beating Portfolios