Should You Buy or Sell Boston Scientific Stock Ahead of Its Upcoming Earnings?

Boston Scientific (NYSE:BSX) is scheduled to report its earnings on Wednesday, July 23, 2025.
Over the past five years, BSX stock has demonstrated a positive one-day return in 60% of instances following its earnings announcements. The median positive return observed on these days was 3.2%, with a maximum one-day positive return reaching 6.2%.
For event-driven traders, while the company’s results against consensus and expectations will be a primary determinant, understanding these historical patterns can potentially provide a strategic advantage. Traders have two main strategies to consider regarding BSX’s earnings:
- Pre-Earnings Positioning: Based on the historical probabilities, one could opt to establish a position before the earnings report is released.
- Post-Earnings Positioning: Alternatively, after the earnings announcement, traders can analyze the correlation between immediate and medium-term returns to inform their positioning.
Current consensus estimates for BSX’s upcoming earnings report are $0.72 per share on sales of $4.89 billion. This represents a notable improvement compared to the year-ago quarter, which reported earnings of $0.62 per share on sales of $4.12 billion.
- Is BSX Stock A Value Trap Or A Rebound Play?
- Stronger Bet Than IDEXX Laboratories Stock: DXCM, BSX Deliver More
- Why BSX Could Outperform Stryker Stock
- Why DXCM, BSX Could Outperform Edwards Lifesciences Stock
- Time To Buy The Dip In Boston Scientific Stock?
- Why BSX Stock’s Q1 Beat Is A Lagging Indicator
From a fundamental perspective, BSX currently holds a market capitalization of $153 billion. Over the last twelve months, the company generated revenues of $18 billion, achieved $3.2 billion in operating profits, and reported a net income of $2.0 billion.
That said, if you seek upside with lower volatility than individual stocks, the Trefis High Quality portfolio presents an alternative — having outperformed the S&P 500 and generated returns exceeding 91% since its inception. Separately, see – RGTI Stock: Path To 10x Growth
See earnings reaction history of all stocks
Image by OsloMetX from Pixabay
Boston Scientific’s Historical Odds Of Positive Post-Earnings Return
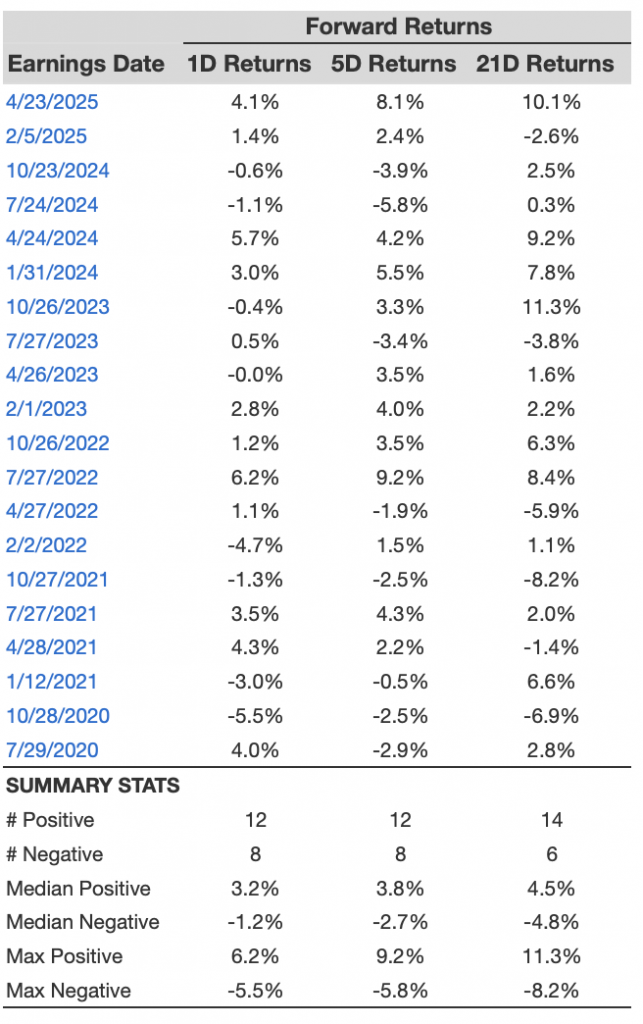
Some observations on one-day (1D) post-earnings returns:
- There are 20 earnings data points recorded over the last five years, with 12 positive and 8 negative one-day (1D) returns observed. In summary, positive 1D returns were seen about 60% of the time.
- Notably, this percentage increases to 67% if we consider data for the last 3 years instead of 5.
- Median of the 12 positive returns = 3.2%, and median of the 8 negative returns = -1.2%
Additional data for observed 5-Day (5D), and 21-Day (21D) returns post earnings are summarized along with the statistics in the table below.
BSX 1D, 5D, and 21D Post Earnings Return
Correlation Between 1D, 5D, and 21D Historical Returns
A relatively less risky strategy (though not useful if the correlation is low) is to understand the correlation between short-term and medium-term returns post earnings, find a pair that has the highest correlation, and execute the appropriate trade. For example, if 1D and 5D show the highest correlation, a trader can position themselves “long” for the next 5 days if 1D post-earnings return is positive. Here is some correlation data based on 5-year and 3-year (more recent) history. Note that the correlation 1D_5D refers to the correlation between 1D post-earnings returns and subsequent 5D returns.
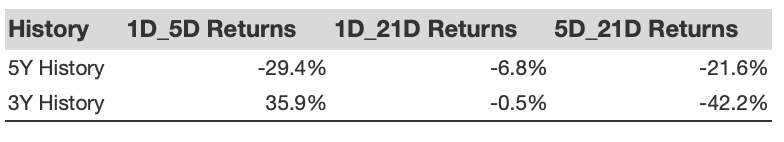
BSX Correlation Between 1D, 5D and 21D Historical Returns
Is There Any Correlation With Peer Earnings?
Sometimes, peer performance can have influence on post-earnings stock reaction. In fact, the pricing-in might begin before the earnings are announced. Here is some historical data on the past post-earnings performance of Boston Scientific stock compared with the stock performance of peers that reported earnings just before Boston Scientific. For fair comparison, peer stock returns also represent post-earnings one-day (1D) returns.
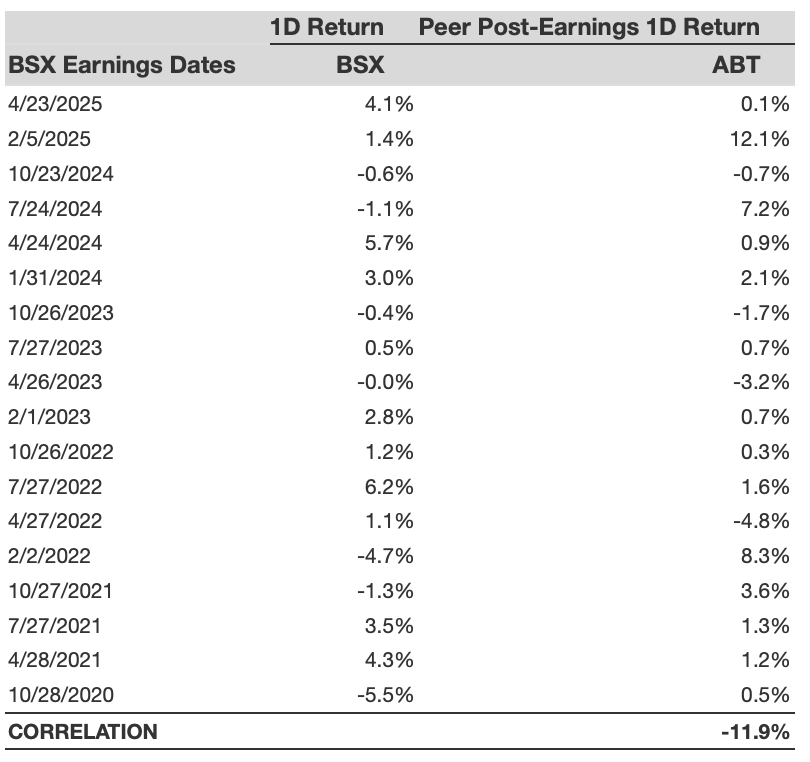
BSX Correlation With Peer Earnings
Learn more about Trefis RV strategy that has outperformed its all-cap stocks benchmark (combination of all 3, the S&P 500, S&P mid-cap, and Russell 2000), to produce strong returns for investors. Separately, if you want upside with a smoother ride than an individual stock like Boston Scientific, consider the High Quality portfolio, which has outperformed the S&P, and clocked >91% returns since inception.
Invest with Trefis Market-Beating Portfolios
See all Trefis Price Estimates