How Will Acuity Stock React To Its Upcoming Earnings?

Commercial and industrial lighting company Acuity (NYSE:AYI) is set to report its earnings on Thursday, June 26, 2025. Per consensus estimates, sales are expected to grow by 18% year-over-year to $1.15 billion, while earnings are likely to come in at about $4.39 per share, up from $4.15 in the year-ago period. Growth is likely to be driven in part by the company’s acquisition of video and control solutions company QSC, although this could be partly offset by uncertainty in the broader market and challenges related to tariffs on imports into the U.S.
Acuity sources a considerable amount of its lighting products from Asia and Mexico. The company has $8.6 billion in current market capitalization. Revenue over the last twelve months was $4.0 billion, and it was operationally profitable with $546 million in operating profits and net income of $417 million.That said, if you seek upside with lower volatility than individual stocks, the Trefis High Quality portfolio presents an alternative – having outperformed the S&P 500 and generated returns exceeding 91% since its inception.
See earnings reaction history of all stocks
Acuity’s Historical Odds Of Positive Post-Earnings Return
- Buying ADSK at a Discount? You Are Getting Paid to Do It
- What Could Spark the Next Big Move In Lam Research Stock
- Cash Machine Trading Cheap – Shift4 Payments Stock Set to Run?
- Should You Pay Attention To Micron Technology Stock’s Momentum?
- Is Wall Street Underestimating Las Vegas Sands Stock’s Potential?
- With Strong Cash Flow, Chemed Stock Poised to Rise?
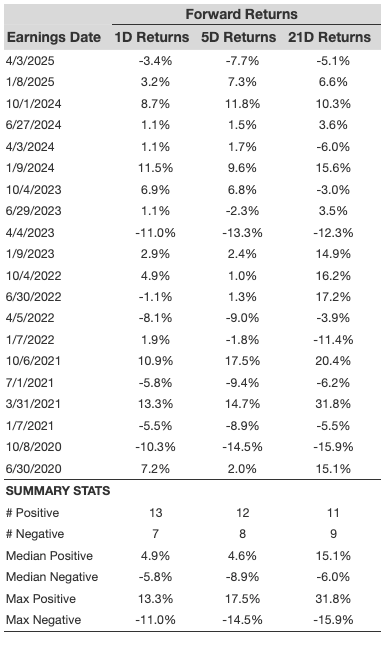
Some observations on one-day (1D) post-earnings returns:
- There are 20 earnings data points recorded over the last five years, with 13 positive and 7 negative one-day (1D) returns observed. In summary, positive 1D returns were seen about 65% of the time.
- Notably, this percentage increases to 75% if we consider data for the last 3 years instead of 5.
- Median of the 13 positive returns = 4.9%, and median of the 7 negative returns = -5.8%
Additional data for observed 5-Day (5D), and 21-Day (21D) returns post earnings are summarized along with the statistics in the table below.
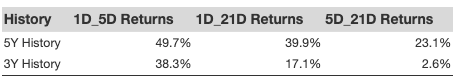
Correlation Between 1D, 5D, and 21D Historical Returns
A relatively less risky strategy (though not useful if the correlation is low) is to understand the correlation between short-term and medium-term returns post earnings, find a pair that has the highest correlation, and execute the appropriate trade. For example, if 1D and 5D show the highest correlation, a trader can position themselves “long” for the next 5 days if 1D post-earnings return is positive. Here is some correlation data based on 5-year and 3-year (more recent) history. Note that the correlation 1D_5D refers to the correlation between 1D post-earnings returns and subsequent 5D returns.
Learn more about Trefis RV strategy that has outperformed its all-cap stocks benchmark (combination of all 3, the S&P 500, S&P mid-cap, and Russell 2000), to produce strong returns for investors. Separately, if you want upside with a smoother ride than an individual stock like Acuity, consider the High Quality portfolio, which has outperformed the S&P, and clocked >91% returns since inception.
Invest with Trefis Market Beating Portfolios
See all Trefis Price Estimates