
ANET Has Left Its Peers Behind. Or Has It?
This networking leader’s fundamentals are near the top of its class, but its stock performance has been left behind, forcing investors to ask if the market is right to be so cautious.
Arista Networks (ANET) builds the high-speed plumbing for AI and cloud data centers, yet its stock performance ranks near the bottom of its peer group while its operational delivery sits near the top. The market has created a clear mismatch between the company’s price and its results, posing a sharp question for investors: is the market’s caution justified, or has Arista’s execution simply not been given credit yet?
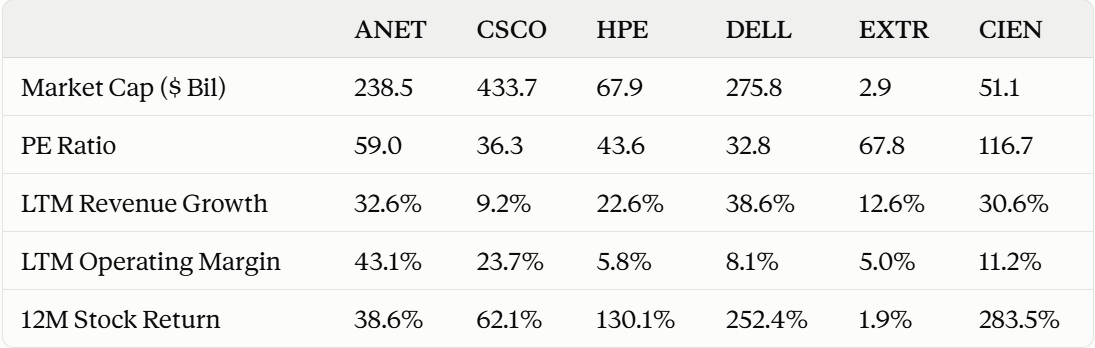
The gap between Arista’s performance and its peers is stark. The company leads its competitive group with an operating margin of 43% and ranks second for revenue growth over the last twelve months. Yet its stock return of +39% over the same period places it fifth out of six. For contrast, Dell Technologies delivered a stunning +252% return on lower operating margins of 8.1%. Even legacy player Cisco Systems, with revenue growth of just 9.2%, saw its stock return +62%, outpacing Arista.
Arista trades at 59.0 times earnings, the third-highest multiple in the group behind Extreme Networks (67.8x) and Ciena (116.7x), reflecting confidence in its profitability. But the stock’s lagging return suggests the market is weighing another factor more heavily than the company’s execution.

Why is the market pricing in a growth ceiling?
The answer lies in the supply chain. Arista is seeing great demand, recently delivering its first $3 billion quarter in revenue in Q2 2026. Management is so confident in its ability to meet this demand that it has raised its outlook multiple times. The company is aggressively securing its future, with multiyear purchase commitments now at “approximately $9.7 billion,” nearly triple the level from a year ago. It has also diversified its operations across “3 contract manufacturers and 3 distribution facilities” to increase resilience.
But here is the honest catch: the market may be looking past Arista’s individual efforts to the broader industry picture. Management has been candid, stating that the “industry is going to have a 2-year problem” with supply that may not be resolved until 2028. The debate over Arista’s valuation premium is a key part of this story. While the company has taken decisive steps, it cannot entirely escape an industry-wide component shortage. The market’s caution seems rooted in a fear that these external constraints will ultimately create a ceiling on growth, no matter how well Arista executes.
For investors looking for broader exposure to this theme, a technology ETF like XLK offers one way to participate in the sector’s overall growth.
Will Arista deliver its guided $3.3 billion third quarter?
Will Arista deliver its guided $3.3 billion third quarter? That target implies roughly 10% sequential growth on the $3.0 billion just delivered in Q2 — achievable on current trends, but exposed to the same component constraints management has flagged industry-wide.
This piece pulled one thread; our full peer-by-peer dashboards for ANET lay every metric side by side, updated daily.
Even The Best Of The Group Is Still One Stock
Whichever name wins a peer comparison, buying it concentrates you in one company and one industry, and industries move together: when the group catches a cold, the best house on the block still sneezes.
The Trefis High Quality (HQ) Portfolio diversifies across roughly 30 quality names in different industries, selected on fundamentals and re-balanced with discipline, so no single group’s weather decides the outcome. It has a track record of outpacing a benchmark that combines the three major indices – the S&P 500, S&P Mid-cap, and Russell 2000. Use the comparison to understand the stock; use the portfolio to own the market’s best.