How Will Amcor Stock React To Its Upcoming Earnings?

Amcor (NYSE:AMCR), the global packaging company, is set to report its earnings on Thursday, August 14, 2025. The company has $22 Bil in current market capitalization. Revenue over the last twelve months was $13 Bil, and it was operationally profitable with $1.4 Bil in operating profits and net income of $807 Mil. While a lot will depend on how results stack up against consensus and expectations, understanding historical patterns might just turn the odds in your favor if you are an event-driven trader.
There are two ways to do that: understand the historical odds and position yourself prior to the earnings release, or look at the correlation between immediate and medium-term returns post earnings and position yourself accordingly after the earnings are released. That said, if you seek upside with lower volatility than individual stocks, the Trefis High Quality portfolio presents an alternative – having outperformed the S&P 500 and generated returns exceeding 91% since its inception.
See earnings reaction history of all stocks

- What’s Next For Fortinet Stock?
- Why Okta’s Slower Growth Is Pressuring The Stock
- Nvidia Stock’s Cheap 25x Multiple The Loudest Warning Yet?
- What Could Rocket Advanced Micro Devices Stock to New Heights
- The Risk Factors to Watch Out For in Tesla Stock
- PayPal Stock: Strong Cash Flow Poised for a Re-Rating?
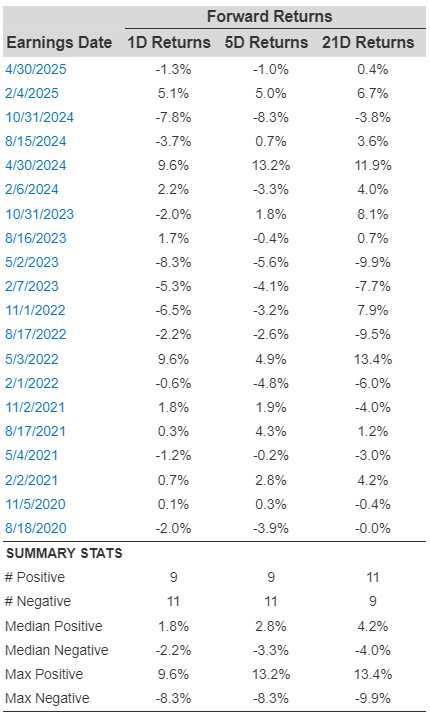
Amcor’s Historical Odds Of Positive Post-Earnings Return
Some observations on one-day (1D) post-earnings returns:
- There are 20 earnings data points recorded over the last five years, with 9 positive and 11 negative one-day (1D) returns observed. In summary, positive 1D returns were seen about 45% of the time.
- However, this percentage decreases to 33% if we consider data for the last 3 years instead of 5.
- Median of the 9 positive returns = 1.8%, and median of the 11 negative returns = -2.2%
Additional data for observed 5-Day (5D) and 21-Day (21D) returns post earnings are summarized along with the statistics in the table below.
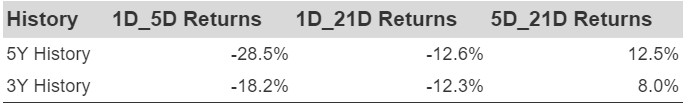
Correlation Between 1D, 5D, and 21D Historical Returns
A relatively less risky strategy (though not useful if the correlation is low) is to understand the correlation between short-term and medium-term returns post earnings, find a pair that has the highest correlation, and execute the appropriate trade. For example, if 1D and 5D show the highest correlation, a trader can position themselves “long” for the next 5 days if the 1D post-earnings return is positive. Here is some correlation data based on a 5-year and a 3-year (more recent) history. Note that the correlation 1D_5D refers to the correlation between 1D post-earnings returns and subsequent 5D returns.
Learn more about Trefis RV strategy that has outperformed its all-cap stocks benchmark (combination of all 3, the S&P 500, S&P mid-cap, and Russell 2000), to produce strong returns for investors. Separately, if you want upside with a smoother ride than an individual stock like Amcor, consider the High Quality portfolio, which has outperformed the S&P and clocked >91% returns since inception.