How Will AIG Stock React To Its Upcoming Earnings?
AIG (NYSE:AIG) is expected to report its earnings on Wednesday, August 6, 2025. Earnings are projected to come in at about $1.60 per share, per consensus estimates, while revenues are likely to grow by about 4.5% to $6.85 billion. AIG has been increasingly focusing on property and casualty insurance following the spinoff of its life insurance and retirement business. While Q1 was a tough quarter due to the catastrophe losses associated with the Los Angeles wildfires, Q2 is likely to see some normalization in underwriting results. Moreover, AIG’s growth in commercial lines and international markets, along with strategic initiatives to improve operational efficiency, could help to drive its performance.

The company has $46 billion in current market capitalization. Revenue over the last twelve months was $27 billion, with net losses standing at $-1.9 billion. While a lot will depend on how results stack up against consensus and expectations, understanding historical patterns might just turn the odds in your favor if you are an event-driven trader.
There are two ways to do that: understand the historical odds and position yourself prior to the earnings release, or look at the correlation between immediate and medium-term returns post earnings and position yourself accordingly after the earnings are released. That said, if you seek upside with lower volatility than individual stocks, the Trefis High Quality portfolio presents an alternative – having outperformed the S&P 500 and generated returns exceeding 91% since its inception.
- American International Group Stock Up 7% Over Last Year, What’s Next?
- American International Group Stock Is Up 9% YTD, What’s Next?
- Up 14% In The Last Twelve Months, What To Expect From American International Group Stock In Q4?
- Up 9% In The Last One Month, Where Is American International Group Stock Headed?
- American International Group Stock Is Undervalued
- American International Group’s Stock Is Trading Below Its Intrinsic Value
See earnings reaction history of all stocks
American International’s Historical Odds Of Positive Post-Earnings Return
Some observations on one-day (1D) post-earnings returns:
- There are 19 earnings data points recorded over the last five years, with 14 positive and 5 negative one-day (1D) returns observed. In summary, positive 1D returns were seen about 74% of the time.
- Notably, this percentage increases to 75% if we consider data for the last 3 years instead of 5.
- Median of the 14 positive returns = 2.6%, and median of the 5 negative returns = -1.3%
Additional data for observed 5-Day (5D) and 21-Day (21D) returns post earnings are summarized along with the statistics in the table below.
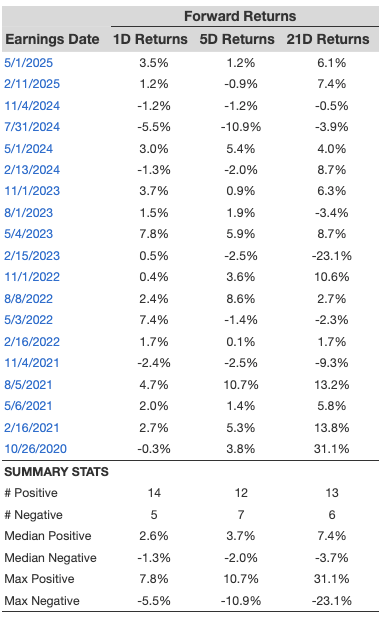
AIG Forward Returns 1D, 5D, 21D Returns
Correlation Between 1D, 5D and 21D Historical Returns
A relatively less risky strategy (though not useful if the correlation is low) is to understand the correlation between short-term and medium-term returns post earnings, find a pair that has the highest correlation, and execute the appropriate trade. For example, if 1D and 5D show the highest correlation, a trader can position themselves “long” for the next 5 days if the 1D post-earnings return is positive. Here is some correlation data based on a 5-year and a 3-year (more recent) history. Note that the correlation 1D_5D refers to the correlation between 1D post-earnings returns and subsequent 5D returns.
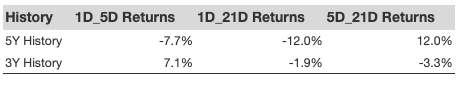
AIG Correlation Between 1D, 5D and 21D Historical Returns
Is There Any Correlation With Peer Earnings?
Sometimes, peer performance can have an influence on post-earnings stock reaction. In fact, the pricing-in might begin before the earnings are announced. Here is some historical data on the past post-earnings performance of American International stock compared with the stock performance of peers that reported earnings just before American International. For fair comparison, peer stock returns also represent post-earnings one-day (1D) returns.
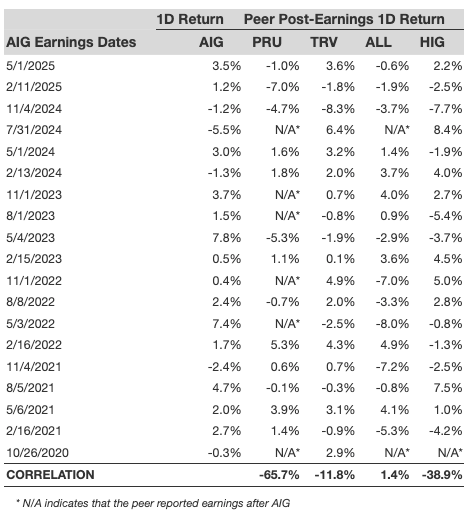
AIG Correlation With Peer Earnings
Learn more about Trefis RV strategy that has outperformed its all-cap stocks benchmark (combination of all 3, the S&P 500, S&P mid-cap, and Russell 2000), to produce strong returns for investors. Separately, if you want upside with a smoother ride than an individual stock like American International, consider the High Quality portfolio, which has outperformed the S&P and clocked >91% returns since inception.
Invest with Trefis Market-Beating Portfolios
See all Trefis Price Estimates