How Will Adobe Stock React To Its Upcoming Earnings?

Adobe (NASDAQ: ADBE) will report its earnings on Thursday, September 11, 2025. Historically, the stock has reacted negatively the day after earnings announcements. Over the past five years, Adobe’s stock has dropped in 75% of instances, with a median decline of 6.3% and a maximum one-day loss of 16.8%.
For event-driven traders, understanding these historical patterns can offer an advantage. You have two main approaches to consider:
- Pre-earnings positioning: Analyze the historical probabilities and take a position before the earnings release.
- Post-earnings positioning: Examine the correlation between immediate and medium-term returns after earnings are released, and then adjust your position accordingly.
Analysts project Adobe’s earnings to be $5.18 per share on sales of $5.9 billion. This is an increase from the same quarter last year, when earnings were $4.65 per share on revenue of $5.4 billion. While the company’s subscription business has been performing well and is likely to drive sales growth this quarter, its revenue growth in the generative AI space has been slower than anticipated. It will be interesting to see how this trend develops in the upcoming report.
Turning to the fundamentals, Adobe currently has a market capitalization of $148 billion. Over the last twelve months, the company generated $23 billion in revenue, with $8.2 billion in operating profits and a net income of $6.9 billion. That being said, if you seek an upside with less volatility than holding an individual stock, consider the High Quality Portfolio. It has comfortably outperformed its benchmark—a combination of the S&P 500, Russell, and S&P MidCap indexes—and has achieved returns exceeding 91% since its inception. Separately, see – AVGO Stock To $600?
See earnings reaction history of all stocks

Image by Hitesh Choudhary from Pixabay
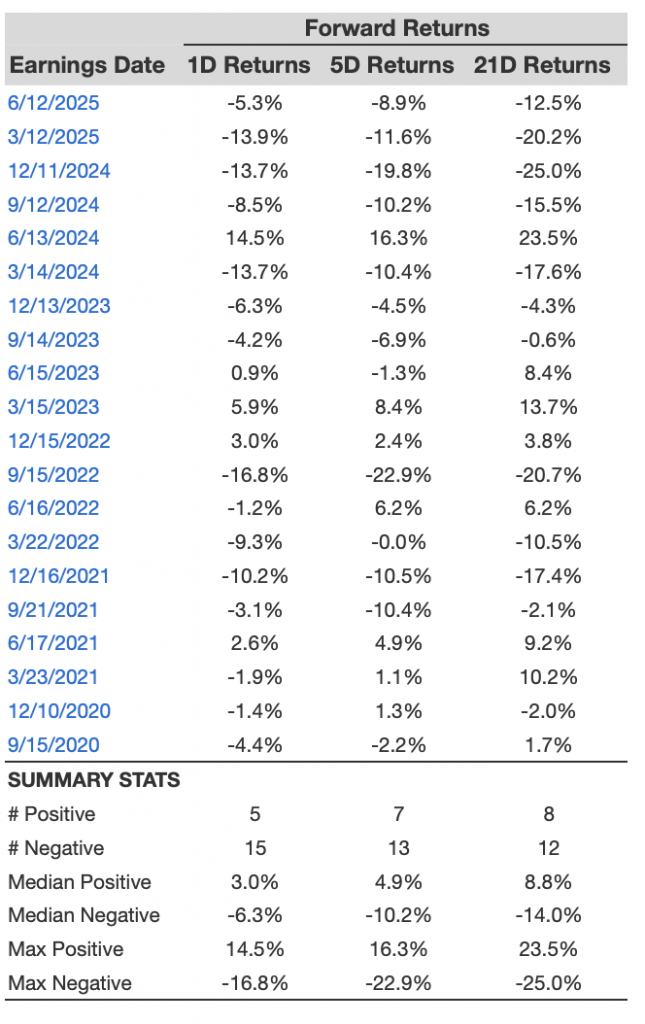
Adobe’s Historical Odds Of Positive Post-Earnings Return
Some observations on one-day (1D) post-earnings returns:
- There are 20 earnings data points recorded over the last five years, with 5 positive and 15 negative one-day (1D) returns observed. In summary, positive 1D returns were seen about 25% of the time.
- Notably, this percentage increases to 33% if we consider data for the last 3 years instead of 5.
- Median of the 5 positive returns = 3.0%, and median of the 15 negative returns = -6.3%
Additional data for observed 5-Day (5D) and 21-Day (21D) returns post earnings are summarized along with the statistics in the table below.
ADBE 1D, 5D, and 21D Post Earnings Return
Correlation Between 1D, 5D, and 21D Historical Returns
A relatively less risky strategy (though not useful if the correlation is low) is to understand the correlation between short-term and medium-term returns post earnings, find a pair that has the highest correlation, and execute the appropriate trade. For example, if 1D and 5D show the highest correlation, a trader can position themselves “long” for the next 5 days if the 1D post-earnings return is positive. Here is some correlation data based on a 5-year and a 3-year (more recent) history. Note that the correlation 1D_5D refers to the correlation between 1D post-earnings returns and subsequent 5D returns.
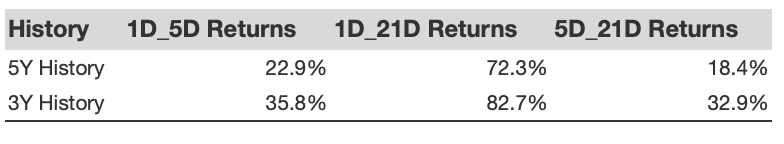
ADBE Correlation Between 1D, 5D, and 21D Historical Returns
Is There Any Correlation With Peer Earnings?
Sometimes, peer performance can have an influence on post-earnings stock reaction. In fact, the pricing-in might begin before the earnings are announced. Here is some historical data on the past post-earnings performance of Adobe stock compared with the stock performance of peers that reported earnings just before Adobe. For fair comparison, peer stock returns also represent post-earnings one-day (1D) returns.
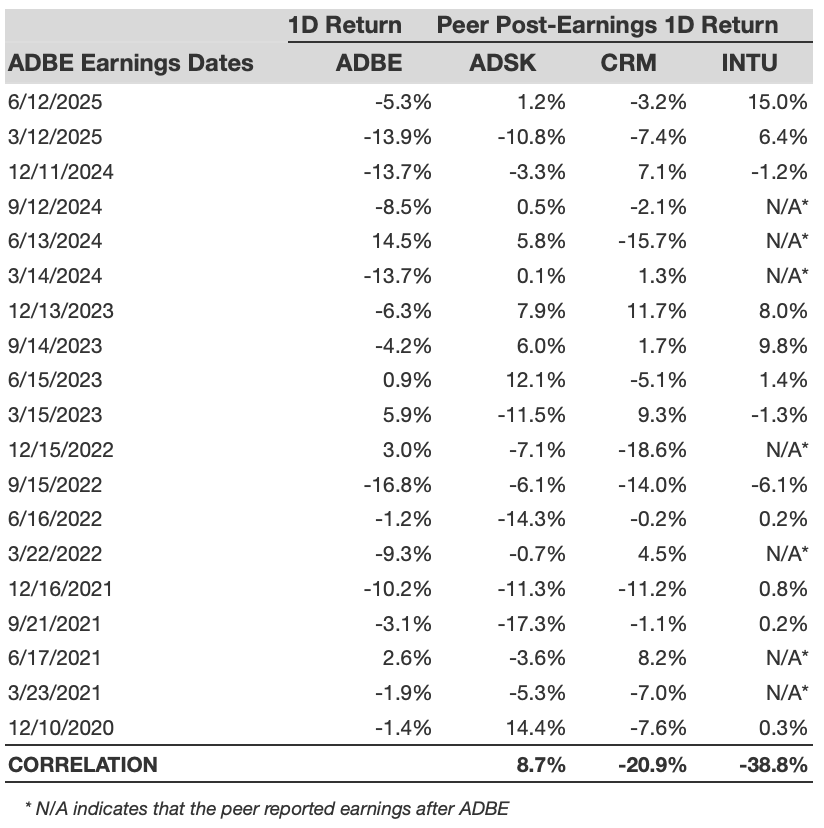
ADBE Correlation With Peer Earnings
Learn more about Trefis RV strategy that has outperformed its all-cap stocks benchmark (combination of all 3, the S&P 500, S&P mid-cap, and Russell 2000), to produce strong returns for investors. Separately, if you want upside with a smoother ride than an individual stock like Adobe, consider the High Quality portfolio, which has outperformed the S&P and clocked >91% returns since inception.
Invest with Trefis Market-Beating Portfolios
See all Trefis Price Estimates