Millicom International Cellular (TIGO)
Market Price (7/19/2026): $98.5 | Market Cap: $16.5 BilSector: Communication Services | Industry: Integrated Telecommunication Services
Millicom International Cellular (TIGO)
Market Price (7/19/2026): $98.5Market Cap: $16.5 BilSector: Communication ServicesIndustry: Integrated Telecommunication Services
Investment Highlights Why It Matters Detailed financial logic regarding cash flow yields vs trend-riding momentum.
Attractive yieldTotal YieldTotal Yield = Earnings Yield + Dividend Yield, Earnings Yield = Net Income / Market Cap Dividend Yield = Total Dividends / Market Cap is 12%, Dividend Yield is 4.3%, ERPEquity Risk Premium (ERP) = Total Yield - Risk Free Rate, Reflects the premium above risk free assets offered by the investment. is 7.7%, FCF Yield is 6.4% Attractive operating marginsOp Mgn LTMOperating Margin = Operating Income / Revenue Reflects profitability before taxes and before impact of capital structure (interest payments). is 24% Attractive cash flow generationCFO/Rev LTMCash Flow from Operations / Revenue (Sales), Last Twelve Months (LTM) is 31%, FCF/Rev LTMFree Cash Flow / Revenue (Sales), Last Twelve Months (LTM) is 16% Low stock price volatilityVol 12M is 38% Megatrend and thematic driversMegatrends include 5G & Advanced Connectivity, and Fintech & Digital Payments. Themes include Wireless Services, Telecom Infrastructure, Show more. | Trading close to highsDist 52W High is 0.0%, Dist 3Y High is 0.0% | Debt is significantNet D/ENet Debt/Equity. Debt net of cash. Negative indicates net cash. Equity is taken as the Market Capitalization is 64% Stock price has recently run up significantly12M Rtn12 month market price return is 169% Valuation getting more expensiveP/S 6M Chg %Price/Sales change over 6 months. Declining P/S indicates valuation has become less expensive. is 61% Key risksTIGO key risks include [1] significant exposure to political and currency instability in its core Latin American markets, Show more. |
| Attractive yieldTotal YieldTotal Yield = Earnings Yield + Dividend Yield, Earnings Yield = Net Income / Market Cap Dividend Yield = Total Dividends / Market Cap is 12%, Dividend Yield is 4.3%, ERPEquity Risk Premium (ERP) = Total Yield - Risk Free Rate, Reflects the premium above risk free assets offered by the investment. is 7.7%, FCF Yield is 6.4% |
| Attractive operating marginsOp Mgn LTMOperating Margin = Operating Income / Revenue Reflects profitability before taxes and before impact of capital structure (interest payments). is 24% |
| Attractive cash flow generationCFO/Rev LTMCash Flow from Operations / Revenue (Sales), Last Twelve Months (LTM) is 31%, FCF/Rev LTMFree Cash Flow / Revenue (Sales), Last Twelve Months (LTM) is 16% |
| Low stock price volatilityVol 12M is 38% |
| Megatrend and thematic driversMegatrends include 5G & Advanced Connectivity, and Fintech & Digital Payments. Themes include Wireless Services, Telecom Infrastructure, Show more. |
| Trading close to highsDist 52W High is 0.0%, Dist 3Y High is 0.0% |
| Debt is significantNet D/ENet Debt/Equity. Debt net of cash. Negative indicates net cash. Equity is taken as the Market Capitalization is 64% |
| Stock price has recently run up significantly12M Rtn12 month market price return is 169% |
| Valuation getting more expensiveP/S 6M Chg %Price/Sales change over 6 months. Declining P/S indicates valuation has become less expensive. is 61% |
| Key risksTIGO key risks include [1] significant exposure to political and currency instability in its core Latin American markets, Show more. |
Qualitative Assessment
AI Analysis | Feedback
Millicom International Cellular (TIGO) stock has gained about 35% since 3/31/2026 because of the following key factors:
1. Millicom reported robust financial performance in fiscal Q1 2026, exceeding expectations. The company's revenue increased by 45.1% year-over-year to $2 billion (4.2% organically), while Adjusted EBITDA rose by 35.5% year-over-year to $857 million. Additionally, Millicom achieved a record first-quarter equity free cash flow of $225 million, marking a 66.5% increase compared to the previous year. Management reaffirmed its full-year 2026 targets, projecting at least $900 million in equity free cash flow and a leverage ratio of approximately 2.5x by year-end.
2. Successful strategic acquisitions and their integration, particularly in Colombia and the expansion into Uruguay, significantly boosted growth. Millicom completed the acquisition of Telefónica's controlling 67.5% stake in Colombia Telecomunicaciones S.A. E.S.P. (Coltel) in February 2026 for USD 214.4 million, and subsequently acquired the remaining 32.5% government stake in April 2026, achieving full ownership. Coltel contributed approximately $243 million to service revenue and $33 million to Adjusted EBITDA in fiscal Q1 2026 alone. In Uruguay, following the acquisition of Movistar in October 2025, Millicom (now Tigo in Uruguay) announced a US$600 million investment in April 2026 to modernize and expand the mobile network.
Show more
Millicom International Cellular (TIGO) stock has gained about 35% since 3/31/2026 because of the following key factors:
1. Millicom reported robust financial performance in fiscal Q1 2026, exceeding expectations. The company's revenue increased by 45.1% year-over-year to $2 billion (4.2% organically), while Adjusted EBITDA rose by 35.5% year-over-year to $857 million. Additionally, Millicom achieved a record first-quarter equity free cash flow of $225 million, marking a 66.5% increase compared to the previous year. Management reaffirmed its full-year 2026 targets, projecting at least $900 million in equity free cash flow and a leverage ratio of approximately 2.5x by year-end.
2. Successful strategic acquisitions and their integration, particularly in Colombia and the expansion into Uruguay, significantly boosted growth. Millicom completed the acquisition of Telefónica's controlling 67.5% stake in Colombia Telecomunicaciones S.A. E.S.P. (Coltel) in February 2026 for USD 214.4 million, and subsequently acquired the remaining 32.5% government stake in April 2026, achieving full ownership. Coltel contributed approximately $243 million to service revenue and $33 million to Adjusted EBITDA in fiscal Q1 2026 alone. In Uruguay, following the acquisition of Movistar in October 2025, Millicom (now Tigo in Uruguay) announced a US$600 million investment in April 2026 to modernize and expand the mobile network.
3. The company enhanced its shareholder return program. At its Annual General Meeting on May 20, 2026, Millicom approved an annual dividend of US$3.00 per share for 2026, to be distributed in four equal quarterly installments, with the first payment expected around July 15, 2026. This demonstrates confidence in the company's financial health and future earnings.
4. Positive sentiment from institutional investors and analysts contributed to the stock's rise. In fiscal Q1 2026, institutional investors such as Goldman Sachs Group Inc. purchased a new position in Millicom valued at $50,664,000. Several analysts also raised their price targets for TIGO, with JPMorgan Chase & Co. boosting its price target from $86.00 to $100.00 in May 2026. The stock currently holds an average rating of "Moderate Buy" with an average price target of $77.28 from analysts.
Show less
Stock Movement Drivers
Fundamental Drivers
The 35.6% change in TIGO stock from 3/31/2026 to 7/18/2026 was primarily driven by a 341.4% change in the company's Net Income Margin (%).| (LTM values as of) | 3312026 | 7182026 | Change |
|---|---|---|---|
| Stock Price ($) | 72.52 | 98.34 | 35.6% |
| Change Contribution By: | |||
| Total Revenues ($ Mil) | 5,804 | 6,429 | 10.8% |
| Net Income Margin (%) | 4.3% | 19.2% | 341.4% |
| P/E Multiple | 49.3 | 13.4 | -72.9% |
| Shares Outstanding (Mil) | 171 | 167 | 2.4% |
| Cumulative Contribution | 35.6% |
Market Drivers
3/31/2026 to 7/18/2026| Return | Correlation | |
|---|---|---|
| TIGO | 35.6% | |
| Market (SPY) | 14.3% | 8.0% |
| Sector (XLC) | -0.2% | 5.2% |
Fundamental Drivers
The 86.0% change in TIGO stock from 12/31/2025 to 7/18/2026 was primarily driven by a 65.7% change in the company's P/E Multiple.| (LTM values as of) | 12312025 | 7182026 | Change |
|---|---|---|---|
| Stock Price ($) | 52.86 | 98.34 | 86.0% |
| Change Contribution By: | |||
| Total Revenues ($ Mil) | 5,588 | 6,429 | 15.1% |
| Net Income Margin (%) | 19.6% | 19.2% | -2.2% |
| P/E Multiple | 8.1 | 13.4 | 65.7% |
| Shares Outstanding (Mil) | 167 | 167 | -0.2% |
| Cumulative Contribution | 86.0% |
Market Drivers
12/31/2025 to 7/18/2026| Return | Correlation | |
|---|---|---|
| TIGO | 86.0% | |
| Market (SPY) | 9.3% | 14.2% |
| Sector (XLC) | -5.7% | 10.1% |
Fundamental Drivers
The 192.7% change in TIGO stock from 6/30/2025 to 7/18/2026 was primarily driven by a 208.6% change in the company's Net Income Margin (%).| (LTM values as of) | 6302025 | 7182026 | Change |
|---|---|---|---|
| Stock Price ($) | 33.60 | 98.34 | 192.7% |
| Change Contribution By: | |||
| Total Revenues ($ Mil) | 5,685 | 6,429 | 13.1% |
| Net Income Margin (%) | 6.2% | 19.2% | 208.6% |
| P/E Multiple | 16.1 | 13.4 | -17.1% |
| Shares Outstanding (Mil) | 169 | 167 | 1.2% |
| Cumulative Contribution | 192.7% |
Market Drivers
6/30/2025 to 7/18/2026| Return | Correlation | |
|---|---|---|
| TIGO | 192.7% | |
| Market (SPY) | 21.3% | 8.4% |
| Sector (XLC) | 3.0% | 11.5% |
Fundamental Drivers
The 670.1% change in TIGO stock from 6/30/2023 to 7/18/2026 was primarily driven by a 581.7% change in the company's Net Income Margin (%).| (LTM values as of) | 6302023 | 7182026 | Change |
|---|---|---|---|
| Stock Price ($) | 12.77 | 98.34 | 670.1% |
| Change Contribution By: | |||
| Total Revenues ($ Mil) | 5,585 | 6,429 | 15.1% |
| Net Income Margin (%) | 2.8% | 19.2% | 581.7% |
| P/E Multiple | 13.9 | 13.4 | -4.0% |
| Shares Outstanding (Mil) | 171 | 167 | 2.2% |
| Cumulative Contribution | 670.1% |
Market Drivers
6/30/2023 to 7/18/2026| Return | Correlation | |
|---|---|---|
| TIGO | 670.1% | |
| Market (SPY) | 73.6% | 15.2% |
| Sector (XLC) | 75.4% | 14.9% |
Price Returns Compared
| 2021 | 2022 | 2023 | 2024 | 2025 | 2026 | Total [1] | |
|---|---|---|---|---|---|---|---|
| Returns | |||||||
| TIGO Return | -27% | -43% | 43% | 39% | 152% | 81% | 275% |
| Peers Return | 5% | -35% | -3% | -13% | 16% | 1% | -33% |
| S&P 500 Return | 27% | -19% | 24% | 23% | 16% | 10% | 101% |
Monthly Win Rates [3] | |||||||
| TIGO Win Rate | 42% | 25% | 58% | 75% | 83% | 100% | |
| Peers Win Rate | 50% | 17% | 42% | 58% | 50% | 43% | |
| S&P 500 Win Rate | 75% | 42% | 67% | 75% | 67% | 57% | |
Max Drawdowns [4] | |||||||
| TIGO Max Drawdown | -43% | -54% | -29% | -18% | -11% | -11% | |
| Peers Max Drawdown | -25% | -51% | -36% | -41% | -40% | -44% | |
| S&P 500 Max Drawdown | -5% | -25% | -10% | -8% | -19% | -9% | |
[1] Cumulative total returns since the beginning of 2021
[2] Peers: LILA.
[3] Win Rate = % of calendar months in which monthly returns were positive
[4] Max drawdown represents maximum peak-to-trough decline within a year
[5] 2026 data is for the year up to 7/17/2026 (YTD)
How Low Can It Go
| Event | TIGO | S&P 500 |
|---|---|---|
| Summer-Fall 2023 Five Percent Yield Shock | ||
| % Loss | -13.1% | -9.5% |
| % Gain to Breakeven | 15.0% | 10.5% |
| Time to Breakeven | 26 days | 24 days |
| 2023 SVB Regional Banking Crisis | ||
| % Loss | -26.9% | -6.7% |
| % Gain to Breakeven | 36.8% | 7.1% |
| Time to Breakeven | 285 days | 31 days |
| 2022 Inflation Shock & Fed Tightening | ||
| % Loss | -53.7% | -24.5% |
| % Gain to Breakeven | 116.0% | 32.4% |
| Time to Breakeven | 559 days | 427 days |
| 2020 COVID-19 Crash | ||
| % Loss | -52.5% | -33.7% |
| % Gain to Breakeven | 110.6% | 50.9% |
| Time to Breakeven | 1878 days | 140 days |
| 2013 Taper Tantrum | ||
| % Loss | -14.0% | -0.2% |
| % Gain to Breakeven | 16.3% | 0.2% |
| Time to Breakeven | 29 days | 1 days |
| 2011 US Debt Ceiling Crisis & European Contagion | ||
| % Loss | -22.1% | -17.9% |
| % Gain to Breakeven | 28.3% | 21.8% |
| Time to Breakeven | 5294 days | 123 days |
In The Past
Millicom International Cellular's stock fell -1.0% during the 2025 US Tariff Shock. Such a loss loss requires a 1.0% gain to breakeven.
Preserve Wealth
Limiting losses and compounding gains is essential to preserving wealth.
Asset Allocation
Actively managed asset allocation strategies protect wealth. Learn more.
| Event | TIGO | S&P 500 |
|---|---|---|
| 2023 SVB Regional Banking Crisis | ||
| % Loss | -26.9% | -6.7% |
| % Gain to Breakeven | 36.8% | 7.1% |
| Time to Breakeven | 285 days | 31 days |
| 2022 Inflation Shock & Fed Tightening | ||
| % Loss | -53.7% | -24.5% |
| % Gain to Breakeven | 116.0% | 32.4% |
| Time to Breakeven | 559 days | 427 days |
| 2020 COVID-19 Crash | ||
| % Loss | -52.5% | -33.7% |
| % Gain to Breakeven | 110.6% | 50.9% |
| Time to Breakeven | 1878 days | 140 days |
| 2011 US Debt Ceiling Crisis & European Contagion | ||
| % Loss | -22.1% | -17.9% |
| % Gain to Breakeven | 28.3% | 21.8% |
| Time to Breakeven | 5294 days | 123 days |
| 2008-2009 Global Financial Crisis | ||
| % Loss | -78.2% | -53.4% |
| % Gain to Breakeven | 359.4% | 114.4% |
| Time to Breakeven | 925 days | 1085 days |
| Summer 2007 Credit Crunch | ||
| % Loss | -29.7% | -8.6% |
| % Gain to Breakeven | 42.3% | 9.5% |
| Time to Breakeven | 68 days | 47 days |
In The Past
Millicom International Cellular's stock fell -1.0% during the 2025 US Tariff Shock. Such a loss loss requires a 1.0% gain to breakeven.
Preserve Wealth
Limiting losses and compounding gains is essential to preserving wealth.
Asset Allocation
Actively managed asset allocation strategies protect wealth. Learn more.
About Millicom International Cellular (TIGO)
Millicom International Cellular S.A. (TIGO) is a telecommunications company that provides a broad range of cable and mobile services across its primary markets in Latin America and Africa. The company operates as a key provider of essential communication and digital services, connecting a diverse base of individual consumers, households, and businesses throughout its operational footprint.
TIGO's service portfolio is extensive, encompassing core mobile services like mobile data, voice communication, and short message services (SMS). A significant component of its offering is mobile financial services, which facilitate critical functions such as payments, money transfers, international remittances, savings, real-time loans, and micro-insurance. For residential customers, Millicom delivers cable and other fixed services, including high-speed broadband internet, a variety of content options, fixed voice telephony, and pay-TV.
In addition to consumer services, Millicom, under its "Tigo Business" brand, also caters to the needs of small, medium, and large businesses, as well as governmental entities. These enterprise-focused offerings include fixed connectivity, managed services, cloud solutions, and security solutions, alongside other value-added services. As of December 31, 2021, the company served a substantial customer base, including approximately 44.9 million mobile customers and providing services to 12.7 million cable homes.
```AI Analysis | Feedback
1. It's like the Verizon or Vodafone of Latin America and Africa.
2. Think of it as a blend of T-Mobile (for mobile) and Comcast (for home internet/TV), but operating in Latin America and Africa.
3. A regional Vodafone for Latin America and Africa, with a strong focus on mobile financial services.
AI Analysis | Feedback
- Mobile Communication Services: Provides mobile data, voice calls, and short message service (SMS).
- Mobile Financial Services: Offers a suite of financial services including payments, money transfers, international remittances, savings, real-time loans, and micro-insurance.
- Residential Fixed Services: Delivers broadband internet, pay-TV, content, and fixed-line voice services to homes.
- Business and Government Solutions: Offers fixed connectivity, managed services, cloud solutions, security solutions, and other value-added services for businesses and governmental entities.
AI Analysis | Feedback
Millicom International Cellular (TIGO) primarily sells its services to individuals, though it also serves businesses and governmental entities. Its major customer categories include:
- Mobile Customers: Individuals who utilize the company's mobile data and voice services, short message service (SMS), and mobile financial services such as payments, money transfers, international remittances, savings, real-time loans, and micro-insurance. As of December 31, 2021, the company served 44.9 million mobile customers.
- Residential Consumers: Individuals and households who subscribe to cable and other fixed services, including broadband internet, content, fixed voice, and pay-TV. As of December 31, 2021, the company served 12.7 million cable homes.
- Businesses and Governmental Entities: Small, medium, and large businesses, as well as government organizations, that leverage Tigo's fixed, managed services, cloud and security solutions, and various value-added services.
AI Analysis | Feedback
Ericsson (NASDAQ: ERIC)
Nokia Corporation (NYSE: NOK)
AI Analysis | Feedback
Marcelo Benitez
Chief Executive Officer
Marcelo Benitez was appointed CEO of Millicom, effective June 1, 2024. He has a long and distinguished career with Millicom, having joined the company in Paraguay in 1997. Throughout his tenure, he has held various senior positions across Latin America and Africa, including CEO of Tigo Panama, Vice President for the Central America Region, General Manager of Tigo El Salvador, and General Manager of Tigo Business (Tigo's B2B operation). Mr. Benitez oversaw the successful integration of Cable Onda and Movistar Panama, solidifying Tigo's position as a leading telecom provider in Panama.
Bart Vanhaeren
Chief Financial Officer
Bart Vanhaeren assumed the role of Chief Financial Officer, succeeding Sheldon Bruha, effective April 15, 2024. A fourteen-year veteran of Millicom, he previously served as the company's VP Corporate Finance, where he was responsible for Treasury, Tax, Mergers & Acquisitions, and Corporate Administration activities. Prior to joining Millicom, Mr. Vanhaeren held leadership roles at global organizations such as Strategy and Corporate Development Manager for EMEA at 3M, Senior Consultant at Deloitte, and Senior Auditor at PriceWaterhouseCoopers.
Mauricio Ramos
Chair of the Board (with Executive Responsibilities)
Mauricio Ramos served as the Chief Executive Officer of Millicom International Cellular from 2015 to 2024. Following his tenure as CEO, he transitioned to continue performing key executive roles, overseeing external stakeholder relations, including government relations, joint venture partners, M&A, and legal, governance, and regulatory matters, and is also listed as Chair of the Board. Before joining Millicom, he was President of Liberty Global's Latin American division from 2006 to 2015. During his time at Liberty Global, he held several leadership positions, including Chairman and CEO of VTR in Chile, CFO of Liberty's Latin American division, and President of Liberty Puerto Rico. He has a background in economics and law.
Salvador Escalon
Executive Vice President and Chief Legal & Compliance Officer
Salvador Escalon serves as the Executive Vice President and Chief Legal & Compliance Officer at Millicom. He is responsible for the company's legal and compliance affairs across its operations.
Susy Bobenrieth
Executive Vice President, Chief Human Resources Officer
Susy Bobenrieth holds the position of Executive Vice President, Chief Human Resources Officer at Millicom (Tigo).
AI Analysis | Feedback
Key Risks to Millicom International Cellular (TIGO):
- Currency Volatility and Macroeconomic Risks: Millicom operates predominantly in emerging markets in Latin America, exposing it significantly to fluctuations in local currencies against the US dollar. This volatility directly impacts reported revenues, profits, and the ability to repatriate cash, particularly from jurisdictions with currency illiquidity such as Bolivia. Economic slowdowns and general economic uncertainty in these regions further amplify this risk.
- Regulatory and Political Risks: The company faces an evolving and often stringent regulatory landscape across its Latin American operating countries, including challenges related to antitrust, spectrum allocation, consumer protection, and mobile financial services. Adverse regulatory decisions, unexpected fines, or changes in laws can significantly impact operations and cash flow. Political instability, corruption, and the need to comply with international regulations such as anti-bribery laws (e.g., the recent DOJ investigation in Guatemala) also pose substantial risks.
- Intense Competition and High Capital Expenditure (CapEx): The telecommunications sector in Millicom's markets is characterized by aggressive competition from various players. To maintain and expand its market position, offer new services like 5G, and upgrade its cable and mobile networks, Millicom must incur significant and ongoing capital expenditures. This high CapEx requirement can put pressure on the company's free cash flow generation and overall financial flexibility.
AI Analysis | Feedback
- Low Earth Orbit (LEO) Satellite Internet Providers: Companies like Starlink are deploying satellite constellations that offer direct, high-speed broadband internet access, posing a significant emerging threat to Millicom's fixed broadband services, particularly in areas where traditional cable infrastructure is challenging or costly to expand.
- Over-the-Top (OTT) Streaming Services: The continuous growth and diversification of streaming platforms (e.g., Netflix, Disney+, Amazon Prime Video, HBO Max, and local competitors) directly challenge Millicom's traditional pay-TV and bundled content offerings by providing on-demand alternatives that bypass traditional broadcast and cable distribution.
- Emerging Fintech Platforms: The rapid innovation and expansion of specialized fintech companies offering digital wallets, payment solutions, remittances, and micro-lending directly threaten Millicom's mobile financial services by providing alternative, often more agile and specialized, digital financial solutions.
AI Analysis | Feedback
Here are the addressable market sizes for Millicom International Cellular's (TIGO) main products and services in Latin America and Africa:
Latin America
- Mobile Services (Mobile Data and Voice): The mobile technologies and services market in Latin America generated an estimated $550 billion in 2024, with a forecast to reach $680 billion by 2030. The broader Latin America telecommunication market was valued at USD 159.29 billion in 2025, with mobile data services representing the largest product type, accounting for an estimated 48.3% of total revenue in 2024.
- Mobile Financial Services: The mobile payment market in Latin America generated a revenue of USD 6,813.3 million in 2024 and is projected to reach USD 46,208.9 million by 2030. The Latin America fintech market size was valued at USD 15.23 billion in 2025 and is projected to reach USD 54.01 billion by 2034. The South America mobile payments market, in terms of total transaction value, reached USD 8.27 trillion in 2026 and is projected to climb to USD 15.63 trillion by 2031.
- Cable and Other Fixed Services (Broadband, Pay-TV): The Latin America broadband services market generated a revenue of USD 56,032.8 million in 2024 and is expected to reach USD 82,754.1 million by 2030. The Latin America pay-TV market generated a revenue of USD 25,617.1 million in 2021 and is expected to reach USD 33,775.0 million by 2028. Another source indicates the Latin America Pay TV market was valued at USD 15.29 billion in 2025 and is projected to reach USD 18.88 billion by 2034.
- Fixed, Managed Services, Cloud and Security Solutions (for businesses): The Latin America cloud computing market size was valued at USD 53.85 billion in 2025 and is projected to reach USD 184.85 billion by 2034. Within this, the Latin America cloud managed services market generated a revenue of USD 9,643.1 million in 2024 and is expected to reach USD 24,356.7 million by 2030. The Latin America cloud security market generated a revenue of USD 2,296.5 million in 2024 and is expected to reach USD 4,400.6 million by 2030. The Latin America security orchestration market size was valued at USD 4.24 billion in 2024 and is projected to reach USD 15.81 billion by 2033.
Africa
- Mobile Services (Mobile Data and Voice): Mobile technologies and services in Africa generated $220 billion in economic value in 2024, with a projection to reach $270 billion by 2030. The Africa telecommunication industry was worth approximately $63.17 billion in 2024 and is expected to grow to more than $82.34 billion by 2029. The Africa Mobile Broadband Market is estimated at USD 80.27 billion in 2025 and is expected to reach USD 117.85 billion by 2030.
- Mobile Financial Services: The Africa mobile money market size reached USD 804.9 million in 2024 and is expected to reach USD 3.93 billion by 2033. Another source indicates the Africa mobile money market was valued at USD 24.7 billion in 2024 and is projected to reach nearly USD 47.5 billion by 2031. A different report states the Africa mobile money market size reached USD 9.18 billion in 2025 and is expected to reach USD 67.18 billion by 2034.
- Cable and Other Fixed Services (Broadband, Pay-TV): Africa's pay-TV subscribers are expected to increase from 43 million at the end of 2023 to 55 million by 2029. The Africa television market was valued at USD 87.83 billion in 2025 and is projected to reach USD 223.21 billion by 2034.
- Fixed, Managed Services, Cloud and Security Solutions (for businesses): The Middle East and Africa cloud security market size was estimated at USD 2.88 billion in 2024 and is expected to reach USD 6.58 billion by 2031. The Africa cybersecurity market size is projected to expand from USD 0.68 billion in 2025 to USD 1.42 billion by 2031. The Africa structured cabling market size, relevant for fixed infrastructure, stood at USD 0.87 billion in 2026 and is projected to reach USD 1.28 billion by 2031.
AI Analysis | Feedback
Millicom International Cellular (TIGO) is expected to drive future revenue growth over the next two to three years through several key strategies:
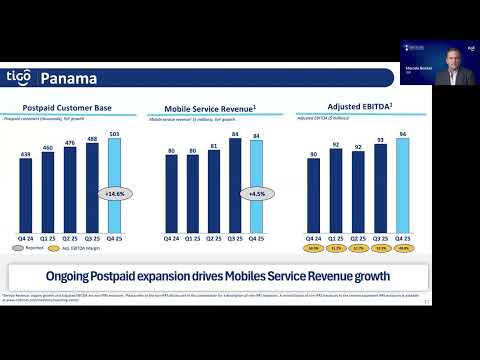
- Sustained Organic Growth in Mobile and Fixed Services, with a focus on Postpaid and ARPU Expansion: Millicom has demonstrated organic service revenue growth, notably 3.2% in Q4 2023, increasing from 1.8% in Q3 2023. This growth is propelled by an expansion in mobile service revenue, particularly through increased Average Revenue Per User (ARPU) in prepaid services and a strategic shift of customers from prepaid to higher-value postpaid subscriptions. The company also emphasizes fixed-mobile convergence strategies and disciplined channel execution to further boost customer acquisition and retention.
- Accelerated Growth in the Business-to-Business (B2B) Segment and Digital Solutions: The B2B segment, encompassing mobile, fixed, and digital services, has been a significant driver, growing 19.6% in Q4 2023, marking its strongest growth rate in recent years. Digital solutions within the B2B segment, including cloud, cybersecurity, and SD-WAN, are expanding rapidly, showing approximately 35% year-over-year growth in the last reported quarter of 2025. This expansion is supported by robust infrastructure and specialized pre-sales and support teams.
- Operational Efficiency Improvements and Enhanced Profitability, particularly in Colombia: Millicom's "Project Everest" efficiency program has been instrumental in driving operational improvements and exceeding cost-saving expectations. The company implemented Phase 2 of this project across its nine operating countries in Q4 2023, which is anticipated to lead to significantly higher EBITDA and lower centrally-managed costs. This initiative, coupled with a focused strategy in Colombia, has resulted in a substantial turnaround in profitability, with Colombia's EBITDA growing over 24% year-on-year (excluding severance costs) and achieving a record 39.5% margin in Q2 2024.
- Strategic Market Consolidation and Expansion through Acquisitions and Infrastructure Optimization: Millicom is strategically reshaping its portfolio to concentrate on core Latin American markets. The company has undertaken strategic acquisitions, including the operations of Telefonica in Ecuador and Uruguay, thereby expanding its market presence and integrating new operations in Chile. Furthermore, a key initiative involves a joint venture with Telefonica in Colombia to establish a jointly-owned mobile infrastructure business, combining network assets and spectrum to enhance mobile access for a large population while simultaneously reducing operating expenses and optimizing capital investment.
AI Analysis | Feedback
Share Repurchases
- Millicom announced a share repurchase program on November 29, 2024, and executed repurchases of 400,821 Swedish Depository Receipts (SDRs) and 146,632 common shares between January 6-10, 2025.
- Between December 9-13, 2024, Millicom repurchased 400,689 SDRs for approximately SEK 109.9 million.
- A share repurchase program announced on December 15, 2023, concluded on May 22, 2024, with 2 million shares repurchased for a total of approximately $35 million.
Share Issuance
- Millicom's delisting of its Swedish Depositary Receipts (SDRs) from Nasdaq Stockholm on March 17, 2025, led to the sale of approximately 5,110,103 shares underlying the SDRs that were not withdrawn by holders, with net proceeds distributed to former SDR holders.
Outbound Investments
- In 2025, Millicom completed the acquisitions of Telefónica's operations in Uruguay and Ecuador for enterprise values of $440 million and $380 million, respectively.
- Subsequent to December 31, 2025, Millicom completed acquisitions in Colombia, including 100% of EPM's remaining shares in Tigo Colombia for approximately $571 million and Telefónica's 67.5% stake in Coltel for approximately $214 million.
- Millicom and EPM jointly capitalized UNE EPM Telecomunicaciones S.A. (Tigo-UNE) in October 2023, with each contributing USD 71 million.
Capital Expenditures
- Millicom's Capital Expenditures were $1.4 billion in 2023, $912.0 million in 2024, and $650 million in FY 2025.
- The company projected its full-year 2025 Cash CapEx to be around $677 million, with an annual Capital Expenditure envelope planned around $700 million.
- Capital expenditures are primarily focused on additions to property, plant, and equipment, operating intangible assets (excluding spectrum and licenses), and network upgrades for 5G and Fiber-to-the-Home (FTTH) infrastructure.
Latest Trefis Analyses
Research & Analysis
Invest in Strategies
Wealth Management
Peer Comparisons
| Peers to compare with: |
Financials
| Median | |
|---|---|
| Name | |
| Mkt Price | 52.84 |
| Mkt Cap | 9.0 |
| Rev LTM | 5,435 |
| Op Inc LTM | 1,142 |
| FCF LTM | 689 |
| FCF 3Y Avg | 506 |
| CFO LTM | 1,400 |
| CFO 3Y Avg | 1,231 |
Growth & Margins
| Median | |
|---|---|
| Name | |
| Rev Chg LTM | 6.7% |
| Rev Chg 3Y Avg | 1.6% |
| Rev Chg Q | 22.5% |
| QoQ Delta Rev Chg LTM | 5.3% |
| Op Inc Chg LTM | 23.8% |
| Op Inc Chg 3Y Avg | 15.0% |
| Op Mgn LTM | 20.3% |
| Op Mgn 3Y Avg | 17.6% |
| QoQ Delta Op Mgn LTM | -1.0% |
| CFO/Rev LTM | 24.6% |
| CFO/Rev 3Y Avg | 22.9% |
| FCF/Rev LTM | 11.8% |
| FCF/Rev 3Y Avg | 9.2% |
Price Behavior
| Market Price | $98.34 | |
| Market Cap ($ Bil) | 16.4 | |
| First Trading Date | 12/29/2006 | |
| Distance from 52W High | 0.0% | |
| 50 Days | 200 Days | |
| DMA Price | $87.23 | $66.42 |
| DMA Trend | up | up |
| Distance from DMA | 12.7% | 48.1% |
| 3M | 1YR | |
| Volatility | 38.0% | 37.7% |
| Downside Capture | -44.54 | -56.63 |
| Upside Capture | 54.18 | 72.72 |
| Correlation (SPY) | 13.3% | 9.8% |
| 1M | 2M | 3M | 6M | 1Y | 3Y | |
|---|---|---|---|---|---|---|
| Beta | 0.23 | 0.40 | 0.27 | 0.40 | 0.24 | 0.32 |
| Up Beta | -0.84 | -0.30 | -0.37 | -0.34 | 0.26 | 0.22 |
| Down Beta | 1.34 | 1.24 | 1.26 | 0.79 | 0.48 | 0.35 |
| Up Capture | 52% | 46% | 67% | 113% | 71% | 46% |
| Bmk +ve Days | 11 | 24 | 40 | 67 | 140 | 429 |
| Stock +ve Days | 14 | 24 | 38 | 75 | 150 | 415 |
| Down Capture | -19% | 10% | -17% | -8% | -86% | 8% |
| Bmk -ve Days | 10 | 17 | 23 | 58 | 112 | 321 |
| Stock -ve Days | 7 | 17 | 25 | 50 | 102 | 332 |
[1] Upside and downside betas calculated using positive and negative benchmark daily returns respectively
Based On 1-Year Data
| Annualized Return | Annualized Volatility | Sharpe Ratio | Correlation with TIGO | |
|---|---|---|---|---|
| TIGO | 171.2% | 37.6% | 2.72 | - |
| Sector ETF (XLC) | 5.1% | 14.0% | 0.12 | 11.3% |
| Equity (SPY) | 20.2% | 12.6% | 1.18 | 8.5% |
| Gold (GLD) | 19.6% | 28.0% | 0.63 | 19.2% |
| Commodities (DBC) | 30.0% | 19.0% | 1.25 | 2.8% |
| Real Estate (VNQ) | 15.7% | 14.0% | 0.81 | 26.1% |
| Bitcoin (BTCUSD) | -46.3% | 42.8% | -1.33 | 10.6% |
Smart multi-asset allocation framework can stack odds in your favor. Learn How
Based On 5-Year Data
| Annualized Return | Annualized Volatility | Sharpe Ratio | Correlation with TIGO | |
|---|---|---|---|---|
| TIGO | 30.0% | 38.6% | 0.78 | - |
| Sector ETF (XLC) | 7.3% | 20.8% | 0.27 | 26.9% |
| Equity (SPY) | 12.8% | 17.1% | 0.57 | 29.7% |
| Gold (GLD) | 16.9% | 18.4% | 0.74 | 16.5% |
| Commodities (DBC) | 8.7% | 19.5% | 0.34 | 10.7% |
| Real Estate (VNQ) | 2.9% | 18.9% | 0.05 | 33.6% |
| Bitcoin (BTCUSD) | 13.6% | 53.5% | 0.44 | 20.0% |
Smart multi-asset allocation framework can stack odds in your favor. Learn How
Based On 10-Year Data
| Annualized Return | Annualized Volatility | Sharpe Ratio | Correlation with TIGO | |
|---|---|---|---|---|
| TIGO | 8.7% | 40.0% | 0.40 | - |
| Sector ETF (XLC) | 9.1% | 22.2% | 0.47 | 30.8% |
| Equity (SPY) | 15.3% | 17.9% | 0.73 | 35.6% |
| Gold (GLD) | 11.0% | 16.1% | 0.55 | 14.9% |
| Commodities (DBC) | 7.0% | 17.9% | 0.31 | 20.0% |
| Real Estate (VNQ) | 5.3% | 20.7% | 0.22 | 38.5% |
| Bitcoin (BTCUSD) | 58.5% | 66.2% | 0.99 | 17.5% |
Smart multi-asset allocation framework can stack odds in your favor. Learn How
Returns Analyses
Earnings Returns History
Updated 6/2/2026| Forward Returns | |||
|---|---|---|---|
| Earnings Date | 1D Returns | 5D Returns | 21D Returns |
| SUMMARY STATS | |||
| # Positive | 0 | 0 | 0 |
| # Negative | 0 | 0 | 0 |
| Median Positive | |||
| Median Negative | |||
| Max Positive | |||
| Max Negative | |||
| Forward Returns | |||
|---|---|---|---|
| Earnings Date | 1D Returns | 5D Returns | 21D Returns |
| SUMMARY STATS | |||
| # Positive | 0 | 0 | 0 |
| # Negative | 0 | 0 | 0 |
| Median Positive | |||
| Median Negative | |||
| Max Positive | |||
| Max Negative | |||
SEC Filings
Expand for More| Report Date | Filing Date | Filing |
|---|---|---|
| 12/31/2025 | 03/24/2026 | 20-F |
| 09/30/2025 | 11/06/2025 | 6-K |
| 06/30/2025 | 08/08/2025 | 6-K |
| 03/31/2025 | 05/08/2025 | 6-K |
| 12/31/2024 | 04/08/2025 | 20-F |
| 09/30/2024 | 11/07/2024 | 6-K |
| 06/30/2024 | 08/05/2024 | 6-K |
| 03/31/2024 | 05/08/2024 | 6-K |
| 12/31/2023 | 03/12/2024 | 20-F |
| 09/30/2023 | 10/26/2023 | 6-K |
| 06/30/2023 | 07/27/2023 | 6-K |
| 03/31/2023 | 04/27/2023 | 6-K |
| 12/31/2022 | 02/28/2023 | 20-F |
| 09/30/2022 | 10/27/2022 | 6-K |
| 06/30/2022 | 07/28/2022 | 6-K |
| 03/31/2022 | 04/28/2022 | 6-K |
| Report Date | Filing Date | Filing |
|---|---|---|
| 12/31/2025 | 03/24/2026 | 20-F |
| 09/30/2025 | 11/06/2025 | 6-K |
| 06/30/2025 | 08/08/2025 | 6-K |
| 03/31/2025 | 05/08/2025 | 6-K |
| 12/31/2024 | 04/08/2025 | 20-F |
| 09/30/2024 | 11/07/2024 | 6-K |
| 06/30/2024 | 08/05/2024 | 6-K |
| 03/31/2024 | 05/08/2024 | 6-K |
| 12/31/2023 | 03/12/2024 | 20-F |
| 09/30/2023 | 10/26/2023 | 6-K |
| 06/30/2023 | 07/27/2023 | 6-K |
| 03/31/2023 | 04/27/2023 | 6-K |
| 12/31/2022 | 02/28/2023 | 20-F |
| 09/30/2022 | 10/27/2022 | 6-K |
| 06/30/2022 | 07/28/2022 | 6-K |
| 03/31/2022 | 04/28/2022 | 6-K |
| 12/31/2021 | 03/01/2022 | 20-F |
| 09/30/2021 | 10/28/2021 | 6-K |
| 06/30/2021 | 07/29/2021 | 6-K |
| 03/31/2021 | 04/29/2021 | 6-K |
| 12/31/2020 | 03/10/2021 | 20-F |
| 09/30/2020 | 10/30/2020 | 6-K |
| 06/30/2020 | 07/30/2020 | 6-K |
| 03/31/2020 | 05/01/2020 | 6-K |
| 12/31/2019 | 02/28/2020 | 20-F |
| 09/30/2019 | 10/24/2019 | 6-K |
| 06/30/2019 | 07/19/2019 | 6-K |
| 03/31/2019 | 04/24/2019 | 6-K |
Insider Activity
Updated 7/6/2026| # | Owner | Title | Holding | Action | Filing Date | Price | Shares | Transacted Value | Value of Held Shares | Form |
|---|---|---|---|---|---|---|---|---|---|---|
| 1 | Trevino, De Vega Blanca | Direct | Sell | 7062026 | 73.92 | 284 | 20,993 | 1,046,929 | Form | |
| 2 | Dimovic, Justine | Direct | Sell | 7062026 | 73.92 | 284 | 20,993 | 632,903 | Form | |
| 3 | Churchill, Bruce | Direct | Sell | 7062026 | 73.92 | 284 | 20,993 | 1,975,808 | Form | |
| 4 | Arnal, Maria Teresa | Direct | Sell | 7062026 | 73.92 | 284 | 20,993 | 1,046,929 | Form | |
| 5 | Lesina, Karim Antonio | EVP, CEA Officer | Direct | Sell | 6152026 | 90.00 | 42,497 | 3,824,730 | 10,629,090 | Form |
| # | Owner | Title | Holding | Action | Filing Date | Price | Shares | Transacted Value | Value of Held Shares | Form |
|---|---|---|---|---|---|---|---|---|---|---|
| 1 | Trevino, De Vega Blanca | Direct | Sell | 7062026 | 73.92 | 284 | 20,993 | 1,046,929 | Form | |
| 2 | Dimovic, Justine | Direct | Sell | 7062026 | 73.92 | 284 | 20,993 | 632,903 | Form | |
| 3 | Churchill, Bruce | Direct | Sell | 7062026 | 73.92 | 284 | 20,993 | 1,975,808 | Form | |
| 4 | Arnal, Maria Teresa | Direct | Sell | 7062026 | 73.92 | 284 | 20,993 | 1,046,929 | Form | |
| 5 | Lesina, Karim Antonio | EVP, CEA Officer | Direct | Sell | 6152026 | 90.00 | 42,497 | 3,824,730 | 10,629,090 | Form |
| 6 | Escalon, Salvador | Chief Legal & Compliance Off. | Direct | Sell | 6032026 | 88.51 | 49,288 | 4,362,719 | 14,635,395 | Form |
Investor Activity (13F)
Updated Jul 19, 2026Active managers (13F portfolio over $250M, at least 3 holdings) with a position over $5M that is either over 10% of their portfolio or held in a concentrated book of 50 or fewer total positions. Index/ETF, sovereign, bank, community-bank and charitable/donor-advised filers are excluded.
| Active Manager |
|---|
Millicom International Cellular — Investor Video Playlist


Industry Resources
| Communication Services Resources |
| Variety |
| The Hollywood Reporter |
| Adweek |
| Integrated Telecommunication Services Resources |
| Fierce Telecom |
| Telecoms.com |
| Light Reading |
External Quote Links
| Y Finance | Barrons |
| TradingView | Morningstar |
| SeekingAlpha | ValueLine |
| Motley Fool | Robinhood |
| CNBC | Etrade |
| MarketWatch | Unusual Whales |
| YCharts | Perplexity Finance |
| FinViz |
Prefer one of these to Trefis? Tell us why.