
Quantum (QMCO)
Market Price (8/12/2026): $19.06 | Market Cap: $419.1 MilSector: Information Technology | Industry: Technology Hardware, Storage & Peripherals
Quantum (QMCO)
Market Price (8/12/2026): $19.06Market Cap: $419.1 MilSector: Information TechnologyIndustry: Technology Hardware, Storage & Peripherals
Investment Highlights Why It Matters Detailed financial logic regarding cash flow yields vs trend-riding momentum.
Cash is significant % of market capNet D/ENet Debt/Equity. Debt net of cash. Negative indicates net cash. Equity is taken as the Market Capitalization is -11% Megatrend and thematic driversMegatrends include Artificial Intelligence, E-commerce Logistics & Data Centers, and Digital Content & Streaming. Themes include Data Centers & Infrastructure, Show more. | Trading close to highsDist 52W High is 0.0% Weak multi-year price returns3Y Excs Rtn is -84% Meaningful short interestShort Interest % of Basic SharesShort Interest % of Basic Shares = (Short Interest Quantity) / (Basic Shares Outstanding). A high fraction of short interest can indicate potential risk of a short squeeze. is 11% | Not profitable at operating income levelOp Inc LTMOperating Income, Last Twelve Months is -1.2 Mil, Op Mgn LTMOperating Margin = Operating Income / Revenue Reflects profitability before taxes and before impact of capital structure (interest payments). is -0.4% Stock price has recently run up significantly6M Rtn6 month market price return is 215%, 12M Rtn12 month market price return is 153% Weak revenue growthRev Chg 3Y AvgRevenue Change % averaged over trailing 3 years is -9.1% Not cash flow generativeCFO/Rev LTMCash Flow from Operations / Revenue (Sales), Last Twelve Months (LTM) is -6.8%, FCF/Rev LTMFree Cash Flow / Revenue (Sales), Last Twelve Months (LTM) is -7.3% Valuation getting more expensiveP/S 6M Chg %Price/Sales change over 6 months. Declining P/S indicates valuation has become less expensive. is 486% Yield minus risk free rate is negativeERPEquity Risk Premium (ERP) = Total Yield - Risk Free Rate, Reflects the premium above risk free assets offered by the investment. is -60% High stock price volatilityVol 12M is 123% Key risksQMCO key risks include [1] profound financial instability, Show more. |
| Cash is significant % of market capNet D/ENet Debt/Equity. Debt net of cash. Negative indicates net cash. Equity is taken as the Market Capitalization is -11% |
| Megatrend and thematic driversMegatrends include Artificial Intelligence, E-commerce Logistics & Data Centers, and Digital Content & Streaming. Themes include Data Centers & Infrastructure, Show more. |
| Trading close to highsDist 52W High is 0.0% |
| Weak multi-year price returns3Y Excs Rtn is -84% |
| Meaningful short interestShort Interest % of Basic SharesShort Interest % of Basic Shares = (Short Interest Quantity) / (Basic Shares Outstanding). A high fraction of short interest can indicate potential risk of a short squeeze. is 11% |
| Not profitable at operating income levelOp Inc LTMOperating Income, Last Twelve Months is -1.2 Mil, Op Mgn LTMOperating Margin = Operating Income / Revenue Reflects profitability before taxes and before impact of capital structure (interest payments). is -0.4% |
| Stock price has recently run up significantly6M Rtn6 month market price return is 215%, 12M Rtn12 month market price return is 153% |
| Weak revenue growthRev Chg 3Y AvgRevenue Change % averaged over trailing 3 years is -9.1% |
| Not cash flow generativeCFO/Rev LTMCash Flow from Operations / Revenue (Sales), Last Twelve Months (LTM) is -6.8%, FCF/Rev LTMFree Cash Flow / Revenue (Sales), Last Twelve Months (LTM) is -7.3% |
| Valuation getting more expensiveP/S 6M Chg %Price/Sales change over 6 months. Declining P/S indicates valuation has become less expensive. is 486% |
| Yield minus risk free rate is negativeERPEquity Risk Premium (ERP) = Total Yield - Risk Free Rate, Reflects the premium above risk free assets offered by the investment. is -60% |
| High stock price volatilityVol 12M is 123% |
| Key risksQMCO key risks include [1] profound financial instability, Show more. |
Qualitative Assessment
AI Analysis | Feedback
Quantum (QMCO) stock has gained about 170% since 4/30/2026 because of the following key factors:
1. Elimination of Debt and Strengthened Balance Sheet: Quantum executed a significant financial restructuring in early June 2026, through a private placement of common stock that generated $100.0 million in gross proceeds, with approximately $94.7 million used to repay existing term debt. Concurrently, convertible notes were converted into common stock, effectively eliminating all outstanding debt and transforming the company into a debt-free entity. This move significantly strengthened its balance sheet, increased cash, cash equivalents, and restricted cash to $54.6 million as of June 30, 2026, and reduced quarterly interest expense from $6.5 million to $2.1 million, removing a major financial overhang and providing capital for growth initiatives.
2. Strong Fiscal Q1 2027 Financial Performance: For its fiscal first quarter ended June 30, 2026, Quantum reported revenue of $80.8 million, exceeding its guidance by $5.8 million and representing a 26% increase year-over-year. The company also achieved its first non-GAAP adjusted net income since fiscal 2023, reporting $4.0 million, or $0.18 per share, significantly surpassing consensus estimates by $0.35 per share. Non-GAAP adjusted EBITDA also saw a substantial turnaround, reaching $8.0 million compared to a negative $6.5 million in the prior year's fiscal Q1 2026.
Show more
Quantum (QMCO) stock has gained about 170% since 4/30/2026 because of the following key factors:
1. Elimination of Debt and Strengthened Balance Sheet: Quantum executed a significant financial restructuring in early June 2026, through a private placement of common stock that generated $100.0 million in gross proceeds, with approximately $94.7 million used to repay existing term debt. Concurrently, convertible notes were converted into common stock, effectively eliminating all outstanding debt and transforming the company into a debt-free entity. This move significantly strengthened its balance sheet, increased cash, cash equivalents, and restricted cash to $54.6 million as of June 30, 2026, and reduced quarterly interest expense from $6.5 million to $2.1 million, removing a major financial overhang and providing capital for growth initiatives.
2. Strong Fiscal Q1 2027 Financial Performance: For its fiscal first quarter ended June 30, 2026, Quantum reported revenue of $80.8 million, exceeding its guidance by $5.8 million and representing a 26% increase year-over-year. The company also achieved its first non-GAAP adjusted net income since fiscal 2023, reporting $4.0 million, or $0.18 per share, significantly surpassing consensus estimates by $0.35 per share. Non-GAAP adjusted EBITDA also saw a substantial turnaround, reaching $8.0 million compared to a negative $6.5 million in the prior year's fiscal Q1 2026.
3. Growing Demand Driven by AI and Record Backlog: Quantum experienced robust demand for its tiered storage solutions, particularly in the context of the proliferation of AI-driven data. This increased demand resulted in a record backlog, indicating strong market relevance and future revenue potential for the company's offerings designed for the AI era.
4. Improved Gross Margins and Operational Efficiency: The company demonstrated enhanced operational efficiency, with its GAAP gross margin improving to 39.3% in fiscal Q1 2027 from 35.3% in the prior year's period. Additionally, non-GAAP adjusted operating expenses were reduced by approximately $4.9 million year-over-year, contributing to the improved profitability and overall financial health.
Show less
Stock Movement Drivers
Fundamental Drivers
The 171.7% change in QMCO stock from 4/30/2026 to 8/11/2026 was primarily driven by a 287.4% change in the company's P/S Multiple.| (LTM values as of) | 4302026 | 8112026 | Change |
|---|---|---|---|
| Stock Price ($) | 7.14 | 19.40 | 171.7% |
| Change Contribution By: | |||
| Total Revenues ($ Mil) | 263 | 296 | 12.6% |
| P/S Multiple | 0.4 | 1.4 | 287.4% |
| Shares Outstanding (Mil) | 14 | 22 | -37.7% |
| Cumulative Contribution | 171.7% |
Market Drivers
4/30/2026 to 8/11/2026| Return | Correlation | |
|---|---|---|
| QMCO | 171.7% | |
| Market (SPY) | 7.2% | 20.5% |
| Sector (XLK) | 16.7% | 30.0% |
Fundamental Drivers
The 212.9% change in QMCO stock from 1/31/2026 to 8/11/2026 was primarily driven by a 348.2% change in the company's P/S Multiple.| (LTM values as of) | 1312026 | 8112026 | Change |
|---|---|---|---|
| Stock Price ($) | 6.20 | 19.40 | 212.9% |
| Change Contribution By: | |||
| Total Revenues ($ Mil) | 257 | 296 | 15.2% |
| P/S Multiple | 0.3 | 1.4 | 348.2% |
| Shares Outstanding (Mil) | 13 | 22 | -39.4% |
| Cumulative Contribution | 212.9% |
Market Drivers
1/31/2026 to 8/11/2026| Return | Correlation | |
|---|---|---|
| QMCO | 212.9% | |
| Market (SPY) | 11.7% | 34.7% |
| Sector (XLK) | 29.5% | 40.1% |
Fundamental Drivers
The 142.2% change in QMCO stock from 7/31/2025 to 8/11/2026 was primarily driven by a 942.0% change in the company's P/S Multiple.| (LTM values as of) | 7312025 | 8112026 | Change |
|---|---|---|---|
| Stock Price ($) | 8.01 | 19.40 | 142.2% |
| Change Contribution By: | |||
| Total Revenues ($ Mil) | 284 | 296 | 4.2% |
| P/S Multiple | 0.1 | 1.4 | 942.0% |
| Shares Outstanding (Mil) | 5 | 22 | -77.7% |
| Cumulative Contribution | 142.2% |
Market Drivers
7/31/2025 to 8/11/2026| Return | Correlation | |
|---|---|---|
| QMCO | 142.2% | |
| Market (SPY) | 22.9% | 34.7% |
| Sector (XLK) | 42.2% | 39.2% |
Fundamental Drivers
The -10.2% change in QMCO stock from 7/31/2023 to 8/11/2026 was primarily driven by a -78.8% change in the company's Shares Outstanding (Mil).| (LTM values as of) | 7312023 | 8112026 | Change |
|---|---|---|---|
| Stock Price ($) | 21.60 | 19.40 | -10.2% |
| Change Contribution By: | |||
| Total Revenues ($ Mil) | 420 | 296 | -29.6% |
| P/S Multiple | 0.2 | 1.4 | 500.4% |
| Shares Outstanding (Mil) | 5 | 22 | -78.8% |
| Cumulative Contribution | -10.2% |
Market Drivers
7/31/2023 to 8/11/2026| Return | Correlation | |
|---|---|---|
| QMCO | -10.2% | |
| Market (SPY) | 74.3% | 13.6% |
| Sector (XLK) | 112.6% | 15.4% |
Price Returns Compared
| 2021 | 2022 | 2023 | 2024 | 2025 | 2026 | Total [1] | |
|---|---|---|---|---|---|---|---|
| Returns | |||||||
| QMCO Return | -10% | -80% | -68% | 672% | -88% | 83% | -90% |
| Peers Return | 35% | -11% | 41% | 49% | 8% | 95% | 435% |
| S&P 500 Return | 27% | -19% | 24% | 23% | 16% | 13% | 106% |
Monthly Win Rates [3] | |||||||
| QMCO Win Rate | 50% | 25% | 33% | 58% | 25% | 50% | |
| Peers Win Rate | 68% | 42% | 60% | 67% | 53% | 65% | |
| S&P 500 Win Rate | 75% | 42% | 67% | 75% | 67% | 50% | |
Max Drawdowns [4] | |||||||
| QMCO Max Drawdown | -48% | -82% | -87% | -84% | -88% | -46% | |
| Peers Max Drawdown | -18% | -31% | -16% | -26% | -38% | -28% | |
| S&P 500 Max Drawdown | -5% | -25% | -10% | -8% | -19% | -9% | |
[1] Cumulative total returns since the beginning of 2021
[2] Peers: NTAP, DELL, HPE, IBM, CVLT.
[3] Win Rate = % of calendar months in which monthly returns were positive
[4] Max drawdown represents maximum peak-to-trough decline within a year
[5] 2026 data is for the year up to 8/11/2026 (YTD)
How Low Can It Go
| Event | QMCO | S&P 500 |
|---|---|---|
| 2025 US Tariff Shock | ||
| % Loss | -37.8% | -18.8% |
| % Gain to Breakeven | 60.9% | 23.1% |
| Time to Breakeven | 408 days | 79 days |
| 2024 Yen Carry Trade Unwind | ||
| % Loss | -39.7% | -7.8% |
| % Gain to Breakeven | 65.8% | 8.5% |
| Time to Breakeven | 98 days | 18 days |
| Summer-Fall 2023 Five Percent Yield Shock | ||
| % Loss | -77.5% | -9.5% |
| % Gain to Breakeven | 344.4% | 10.5% |
| Time to Breakeven | 349 days | 24 days |
| 2023 SVB Regional Banking Crisis | ||
| % Loss | -42.4% | -6.7% |
| % Gain to Breakeven | 73.6% | 7.1% |
| Time to Breakeven | 642 days | 31 days |
| 2020 COVID-19 Crash | ||
| % Loss | -72.2% | -33.7% |
| % Gain to Breakeven | 259.5% | 50.9% |
| Time to Breakeven | 145 days | 140 days |
| Q4 2018 Fed Policy Error / Growth Scare | ||
| % Loss | -44.7% | -19.2% |
| % Gain to Breakeven | 81.0% | 23.8% |
| Time to Breakeven | 131 days | 105 days |
In The Past
Quantum's stock fell -37.8% during the 2025 US Tariff Shock. Such a loss loss requires a 60.9% gain to breakeven.
Preserve Wealth
Limiting losses and compounding gains is essential to preserving wealth.
Asset Allocation
Actively managed asset allocation strategies protect wealth. Learn more.
| Event | QMCO | S&P 500 |
|---|---|---|
| 2025 US Tariff Shock | ||
| % Loss | -37.8% | -18.8% |
| % Gain to Breakeven | 60.9% | 23.1% |
| Time to Breakeven | 408 days | 79 days |
| 2024 Yen Carry Trade Unwind | ||
| % Loss | -39.7% | -7.8% |
| % Gain to Breakeven | 65.8% | 8.5% |
| Time to Breakeven | 98 days | 18 days |
| Summer-Fall 2023 Five Percent Yield Shock | ||
| % Loss | -77.5% | -9.5% |
| % Gain to Breakeven | 344.4% | 10.5% |
| Time to Breakeven | 349 days | 24 days |
| 2023 SVB Regional Banking Crisis | ||
| % Loss | -42.4% | -6.7% |
| % Gain to Breakeven | 73.6% | 7.1% |
| Time to Breakeven | 642 days | 31 days |
| 2020 COVID-19 Crash | ||
| % Loss | -72.2% | -33.7% |
| % Gain to Breakeven | 259.5% | 50.9% |
| Time to Breakeven | 145 days | 140 days |
| Q4 2018 Fed Policy Error / Growth Scare | ||
| % Loss | -44.7% | -19.2% |
| % Gain to Breakeven | 81.0% | 23.8% |
| Time to Breakeven | 131 days | 105 days |
| 2015-2016 China Devaluation / Global Growth Scare | ||
| % Loss | -59.7% | -12.2% |
| % Gain to Breakeven | 148.2% | 13.9% |
| Time to Breakeven | 458 days | 62 days |
| 2013 Taper Tantrum | ||
| % Loss | -23.7% | -0.2% |
| % Gain to Breakeven | 31.1% | 0.2% |
| Time to Breakeven | 189 days | 1 days |
| 2010 Eurozone Sovereign Debt Crisis / Flash Crash | ||
| % Loss | -48.1% | -15.4% |
| % Gain to Breakeven | 92.9% | 18.2% |
| Time to Breakeven | 90 days | 125 days |
| 2008-2009 Global Financial Crisis | ||
| % Loss | -95.9% | -53.4% |
| % Gain to Breakeven | 2345.5% | 114.4% |
| Time to Breakeven | 379 days | 1085 days |
In The Past
Quantum's stock fell -37.8% during the 2025 US Tariff Shock. Such a loss loss requires a 60.9% gain to breakeven.
Preserve Wealth
Limiting losses and compounding gains is essential to preserving wealth.
Asset Allocation
Actively managed asset allocation strategies protect wealth. Learn more.
About Quantum (QMCO)
Quantum Corporation (QMCO) specializes in providing comprehensive solutions for storing and managing large volumes of digital video and unstructured data. The company's offerings are designed to address the challenges of high-speed data ingest, processing, long-term archiving, and secure data protection across various industries. Quantum helps organizations efficiently handle vast datasets, from active production workflows to cold storage and disaster recovery needs.
Quantum's product portfolio includes its flagship StorNext software systems, which enable high-performance data workflows for digital video and imaging. For long-term data preservation, it offers Scalar tape systems and LTO tape technology, providing cost-effective and durable archival solutions. The company also develops DXi backup systems for robust data protection and disaster recovery, alongside specialized surveillance and physical security storage systems for managing video recordings. Additionally, Quantum provides object storage for online content repositories like media archives and big data lakes, as well as in-vehicle storage for mobile data capture.
Quantum primarily serves industries and organizations that generate and manage significant amounts of digital media and unstructured data. Its customer base spans media and entertainment, government agencies, and corporate entities, including those involved in video surveillance, genome sequencing, and big data analytics. The company distributes its products and services through a global network of partners, including distributors, value-added resellers, and OEMs, in addition to direct sales to major clients, operating across the Americas, Europe, the Middle East, Africa, and the Asia Pacific.
```AI Analysis | Feedback
Quantum is like a specialized Dell EMC or NetApp, but laser-focused on providing storage and management systems for massive video, media, and long-term data archives.
Think of them as the on-premise equivalent of AWS S3 Glacier, but for managing and archiving all types of large unstructured data, from active video production to decades of historical records.
AI Analysis | Feedback
- StorNext Software Systems: Software enabling high-speed ingest, editing, processing, and management of digital video and image datasets.
- Scalar Tape Systems: Long-term data storage facilities designed to archive and preserve digital content.
- DXi Backup Systems: Storage solutions specifically for backup and multi-site disaster recovery purposes.
- Surveillance and Physical Security Storage Systems: Includes video recording servers and hyperconverged systems for video surveillance management.
- Appliances for Analytics and Access Control: Dedicated appliances for video surveillance analytics and running various access control systems.
- In-Vehicle Storage Systems: Removable storage designed for in-vehicle data capture, mobile surveillance, and military applications.
- Object Storage Systems: Online content repositories for media archives, genome sequencing data, and big data lakes.
- LTO Tape Products: Offers linear tape-open (LTO) tape cartridges and standalone LTO tape drives.
- Professional Services: Provides managed services, implementation, training, and support services.
AI Analysis | Feedback
Quantum Corporation (QMCO) sells primarily to other companies and government agencies. The provided background information does not list specific names of major customer companies or their public symbols. However, it describes the types of entities that purchase its products and through which channels it sells.
Based on the description, Quantum's major customers and customer categories include:
- Corporate Entities: Businesses across various sectors requiring solutions for digital video and unstructured data storage, management, backup, disaster recovery, and specialized applications. These often include companies in media and entertainment, life sciences, surveillance, and general enterprise IT for needs such as media archives, genome sequencing data repositories, and big data lakes.
- Government Agencies: Public sector organizations, including those involved in military, law enforcement, and other government operations that utilize surveillance, secure data storage, and in-vehicle data capture systems.
- Channel Partners: A network of businesses that integrate or resell Quantum's products and services to their own end-customers. These include:
- Distributors
- Value-Added Resellers (VARs)
- Direct Marketing Resellers (DMRs)
- Original Equipment Manufacturers (OEMs)
AI Analysis | Feedback
- Fujifilm Holdings Corporation (FUJIY)
- Sony Group Corporation (SONY)
AI Analysis | Feedback
Hugues Meyrath, Chief Executive Officer
Hugues Meyrath was appointed Chief Executive Officer of Quantum Corporation effective June 2, 2025. He is a storage industry veteran with over 30 years of experience, having a multifaceted relationship with Quantum as a supplier, employee, competitor, and independent member of the Board of Directors. Meyrath previously held executive roles at Juniper Networks, Brocade Communications, SBS, and Quantum earlier in his career. From 2014 to 2017, he served as Vice President at Dell Technologies Capital, focusing on venture funding, mergers and acquisitions, and advisory roles for portfolio companies. Most recently, he served as Chief Product Officer of ServiceChannel, which was acquired by Fortive in 2021. He also served on Quantum's Board of Directors since September 2022 and has advised startup companies.
William H. White, Chief Financial Officer
William H. White was appointed Chief Financial Officer and Principal Financial Officer of Quantum Corporation, effective February 2, 2026. He brings over two decades of experience transforming technology companies through financial leadership and strategic capital allocation. Most recently, White served as CFO and Head of Revenue Operations at Emotive, a venture-backed SaaS company, where he led a three-year financial and operational turnaround that improved EBITDA and culminated in a successful strategic exit. This indicates experience with a venture-backed company and a successful sale. Earlier in his career, he was Managing Partner at Goldblum Lentz & Co., an investment banking firm, advising on numerous mergers, acquisitions, and capital raises for technology companies, including raising approximately $1 billion in enterprise valuations from leading VC and private equity firms. He also held roles as Fractional CFO and Strategic Finance Consultant at VUCA Strategies, Head of Revenue at Human AI Labs Inc., and Director of Corporate Development & Finance at Affordify Inc.
Tony Craythorne, Chief Revenue Officer
Tony Craythorne is the Chief Revenue Officer at Quantum, responsible for leading global sales and marketing efforts to drive revenue growth and market expansion. He has over 25 years of executive experience across the U.S., Europe, and Asia, with a proven track record of building high-performing teams and scaling revenue growth for technology companies. Before joining Quantum, he served as a contract CRO, assisting startups and growth-stage companies in SaaS, cybersecurity, and data storage with refining their go-to-market strategies. His past leadership roles include Chief Revenue Officer at Index Engines and Zadara, CEO of Bamboo Systems, and Senior Vice President of Worldwide Sales at Komprise, as well as executive positions at Brocade, Hitachi Data Systems, and Nexsan.
Geoff Barrall, Chief Product Officer
Dr. Geoff Barrall serves as Quantum's Chief Product Officer, leading the company's product strategy, innovation, and engineering direction. He is a recognized leader in enterprise storage and data management with a history of building and scaling breakthrough technologies. Barrall most recently served as Chief Product Officer at Index Engines and previously held the role of Chief Technology Officer at Hitachi Vantara. Earlier in his career, he founded several storage technology companies, including BlueArc Corporation (which was acquired by Hitachi), Drobo, and Connected Data.
Robert N. Buergisser, Vice President, Services and Support
Robert N. Buergisser is the Vice President of Global Services at Quantum Corporation, bringing over 20 years of experience in leading teams across all areas of the services business. Prior to his tenure at Quantum, he held senior roles at Brocade Communications and Broadcom, where he managed various functions including Service Operations, SE Operations, Partner Programs, Services Product Management, Education, Professional Services, and Technical Publications. He and his team contributed to driving operational excellence, earning multiple industry awards, including J.D. Power certification for technical support.
AI Analysis | Feedback
Here are the key risks to Quantum Corporation's business:
-
Financial Instability and High Debt Load
Quantum Corporation faces significant financial instability, characterized by a stressed balance sheet and a heavy debt load, which is identified as the most pressing near-term risk. As of the second fiscal quarter of 2026, the company's total outstanding term debt stood at approximately $106.1 million, with net debt around $90.8 million. The company has reported negative shareholder equity and consistently negative Price-to-Earnings (P/E) ratios, signaling ongoing losses. Furthermore, Quantum's operating cash flow has been negative, and its current ratio of 0.40 indicates potential challenges in meeting short-term obligations. An Altman Z-Score of -12.32 suggests a high risk of bankruptcy. The company also expects to violate net leverage ratio financial covenants for the quarter ended December 31, 2025, which could make its Term Loan immediately due.
-
Accounting Issues, Leadership Instability, and Legal Challenges
Quantum has been under scrutiny for significant accounting irregularities, leading to delayed filings of its Annual Report on Form 10-K for the fiscal year ended March 31, 2025, and restatements of past financial results due to issues with revenue recognition practices. This has been compounded by leadership instability, including the abrupt resignations of both the CEO and CFO in August 2025. These issues have resulted in multiple class-action lawsuits alleging securities fraud due to financial misstatements, which can further erode investor trust and lead to potential financial penalties.
-
Declining Revenue from Legacy Business and Execution Risk in Strategic Pivot
The company is experiencing a shrinking top line, with a 12.0% year-over-year revenue decline for fiscal year 2025 and an 11.1% decline in Q1 FY2026, partly due to the loss of a hyperscaler customer and reduced tape media and royalty business. While Quantum is attempting a strategic pivot towards solutions for artificial intelligence (AI) and unstructured data, reversing the structural decline of its legacy storage business is proving to be a significant challenge. There is a high execution risk associated with this transition; if new product launches or upgrades do not meet expectations, the company's turnaround efforts could falter. Additionally, Quantum faces intense competitive pressure from larger storage players who may undercut prices, and supply chain issues have caused longer lead times for certain high-speed systems.
AI Analysis | Feedback
AI Analysis | Feedback
AI Analysis | Feedback
Quantum (QMCO) is expected to drive future revenue growth over the next 2-3 years through several key initiatives and market trends:
- Strategic Focus on AI and High-Performance Computing (HPC) Workloads: Quantum is making a significant pivot to specialize in storage for massive video, sensor, and image files that fuel artificial intelligence (AI) and high-performance computing (HPC) models. This strategic shift to managing unstructured data for the AI era is considered the core growth story, with products like Myriad and ActiveScale specifically addressing these demanding workloads.
- Growth in Subscription Annual Recurring Revenue (ARR) through a Subscription-Based Model: The company is actively transforming its business towards a subscription-based model. This is evidenced by the substantial year-over-year growth in its Subscription Annual Recurring Revenue (ARR), which increased by 29% in the third quarter of fiscal year 2025. This shift aims to enhance profitability and cash flow stability.
- Enhanced Sales Organization and Operational Efficiency Improvements: Improvements within the sales team and broader restructuring efforts are contributing to the company's operational effectiveness and recent revenue growth. These initiatives are designed to accelerate the growth of profitable revenue streams and improve overall execution.
- Increased Demand for Tape Storage Solutions: Quantum has observed a surge in demand for its Scalar tape libraries, with tape sales doubling quarter-over-quarter in Q3 2026. This is attributed to customers pivoting towards architectures that reduce dependence on constrained components and provide predictable economics for managing warm and cold data, highlighting a continued relevance and growth in certain segments of its traditional offerings.
AI Analysis | Feedback
Share Issuance
- Quantum is registering up to 18,207,453 shares of common stock for potential resale by Dialectic Technology SPV LLC, which may be issued upon conversion of $54,718,114 in 10.00% PIK Senior Secured Convertible Notes due 2028.
- The company executed a 1-for-20 reverse stock split on August 27, 2024, reducing the total number of outstanding shares while proportionally increasing the share price.
- Subsequent to December 31, 2025, the 2021 Inducement Plan was amended to increase the number of shares reserved for issuance by 125,000.
Inbound Investments
- In December 2025, shareholders approved the issuance of senior secured convertible notes to Dialectic Technology SPV LLC in exchange for approximately $55 million of term debt, aiming to strengthen the balance sheet and provide financial flexibility.
- This transaction contributed to the company having eliminated $140 million in total debt from its balance sheet since its peak in 2020.
Capital Expenditures
- Capital expenditures in the fiscal third quarter of 2026 (ended December 31, 2025) totaled $0.681 million.
- Purchases of property, plant, and equipment amounted to $681,000 in Q3 2026.
Latest Trefis Analyses
| Title | Date | |
|---|---|---|
| DASHBOARDS | ||
| Quantum Earnings Notes | 12/16/2025 | |
| With Quantum Stock Sliding, Have You Assessed The Risk? | 10/17/2025 |
| Title | |
|---|---|
| ARTICLES |
Research & Analysis
Invest in Strategies
Wealth Management
Peer Comparisons
| Peers to compare with: |
Financials
| Median | |
|---|---|
| Name | |
| Mkt Price | 168.95 |
| Mkt Cap | 56.0 |
| Rev LTM | 22,860 |
| Op Inc LTM | 1,972 |
| FCF LTM | 2,929 |
| FCF 3Y Avg | 1,966 |
| CFO LTM | 4,212 |
| CFO 3Y Avg | 3,246 |
Growth & Margins
| Median | |
|---|---|
| Name | |
| Rev Chg LTM | 13.4% |
| Rev Chg 3Y Avg | 7.3% |
| Rev Chg Q | 19.1% |
| QoQ Delta Rev Chg LTM | 4.6% |
| Op Inc Chg LTM | 19.7% |
| Op Inc Chg 3Y Avg | 13.4% |
| Op Mgn LTM | 8.5% |
| Op Mgn 3Y Avg | 8.1% |
| QoQ Delta Op Mgn LTM | 0.9% |
| CFO/Rev LTM | 19.0% |
| CFO/Rev 3Y Avg | 17.9% |
| FCF/Rev LTM | 14.7% |
| FCF/Rev 3Y Avg | 12.9% |
Segment Financials
Revenue by Segment| $ Mil | 2026 | 2025 | 2024 | 2023 | 2022 |
|---|---|---|---|---|---|
| Product revenue | 172 | 154 | 175 | 275 | 231 |
| Service and subscription | 99 | 111 | 127 | 134 | 137 |
| Royalty | 8 | 9 | 10 | 14 | 15 |
| Total | 280 | 274 | 312 | 422 | 383 |
| $ Mil | 2006 | 2005 | 2004 | 2003 | 2002 |
|---|---|---|---|---|---|
| Tape Drive | 32 | ||||
| Storage systems | -53 | -39 | -50 | -57 | -89 |
| DLTG Tape | 29 | 50 | 41 | ||
| DLT tape | 88 | ||||
| Total | -21 | -10 | -0 | -16 | -1 |
| $ Mil | 1999 |
|---|---|
| Hard Disk Drive Group | 2 |
| DLT & Storage Systems Group | 1 |
| Total | 2 |
Price Behavior
| Market Price | $19.40 | |
| Market Cap ($ Bil) | 0.3 | |
| First Trading Date | 12/29/2006 | |
| Distance from 52W High | 0.0% | |
| 50 Days | 200 Days | |
| DMA Price | $11.86 | $8.36 |
| DMA Trend | indeterminate | up |
| Distance from DMA | 63.6% | 132.0% |
| 3M | 1YR | |
| Volatility | 169.6% | 122.9% |
| Downside Capture | -55.44 | 298.85 |
| Upside Capture | 293.85 | 340.62 |
| Correlation (SPY) | 30.2% | 42.7% |
| 1M | 2M | 3M | 6M | 1Y | 3Y | |
|---|---|---|---|---|---|---|
| Beta | 1.96 | 2.23 | 3.15 | 3.65 | 3.44 | 1.80 |
| Up Beta | 4.47 | 0.68 | 1.84 | 2.88 | 2.21 | 1.32 |
| Down Beta | 1.36 | 4.33 | 3.09 | 4.19 | 4.46 | 0.22 |
| Up Capture | 123% | 275% | 644% | 943% | 1187% | 5161% |
| Bmk +ve Days | 11 | 22 | 35 | 67 | 138 | 427 |
| Stock +ve Days | 10 | 21 | 32 | 63 | 120 | 346 |
| Down Capture | 170% | 161% | 254% | 230% | 184% | 112% |
| Bmk -ve Days | 11 | 21 | 28 | 59 | 114 | 326 |
| Stock -ve Days | 12 | 22 | 31 | 63 | 132 | 402 |
[1] Upside and downside betas calculated using positive and negative benchmark daily returns respectively
Based On 1-Year Data
| Annualized Return | Annualized Volatility | Sharpe Ratio | Correlation with QMCO | |
|---|---|---|---|---|
| QMCO | 149.6% | 122.7% | 1.25 | - |
| Sector ETF (XLK) | 40.7% | 25.9% | 1.28 | 39.1% |
| Equity (SPY) | 22.1% | 12.8% | 1.28 | 34.6% |
| Gold (GLD) | 28.2% | 28.4% | 0.86 | 18.9% |
| Commodities (DBC) | 37.4% | 20.1% | 1.47 | 0.9% |
| Real Estate (VNQ) | 12.5% | 13.8% | 0.61 | 2.2% |
| Bitcoin (BTCUSD) | -45.3% | 42.9% | -1.28 | 26.6% |
Smart multi-asset allocation framework can stack odds in your favor. Learn How
Based On 5-Year Data
| Annualized Return | Annualized Volatility | Sharpe Ratio | Correlation with QMCO | |
|---|---|---|---|---|
| QMCO | -30.9% | 162.3% | 0.38 | - |
| Sector ETF (XLK) | 20.2% | 25.8% | 0.70 | 18.5% |
| Equity (SPY) | 13.3% | 17.2% | 0.60 | 17.5% |
| Gold (GLD) | 18.8% | 18.6% | 0.82 | 3.0% |
| Commodities (DBC) | 9.3% | 19.6% | 0.36 | 0.3% |
| Real Estate (VNQ) | 1.9% | 18.9% | -0.00 | 10.3% |
| Bitcoin (BTCUSD) | 10.9% | 52.8% | 0.39 | 11.1% |
Smart multi-asset allocation framework can stack odds in your favor. Learn How
Based On 10-Year Data
| Annualized Return | Annualized Volatility | Sharpe Ratio | Correlation with QMCO | |
|---|---|---|---|---|
| QMCO | -22.8% | 127.8% | 0.29 | - |
| Sector ETF (XLK) | 24.4% | 24.9% | 0.89 | 21.0% |
| Equity (SPY) | 15.3% | 17.9% | 0.73 | 21.8% |
| Gold (GLD) | 12.0% | 16.2% | 0.61 | 3.4% |
| Commodities (DBC) | 7.9% | 18.0% | 0.35 | 5.8% |
| Real Estate (VNQ) | 4.5% | 20.7% | 0.18 | 16.9% |
| Bitcoin (BTCUSD) | 59.4% | 66.1% | 0.99 | 10.0% |
Smart multi-asset allocation framework can stack odds in your favor. Learn How
Returns Analyses
Earnings Returns History
Updated 8/10/2026| Forward Returns | |||
|---|---|---|---|
| Earnings Date | 1D Returns | 5D Returns | 21D Returns |
| 6/25/2026 | -9.9% | -21.4% | -15.2% |
| 2/17/2026 | -2.5% | -3.9% | -5.5% |
| 11/13/2025 | 11.9% | 4.0% | 13.2% |
| 9/10/2025 | -17.0% | -2.6% | 46.3% |
| 6/3/2025 | 1.2% | -5.0% | -21.8% |
| 2/12/2025 | -14.4% | -29.4% | -34.0% |
| 11/13/2024 | -31.8% | -35.5% | 284.0% |
| 8/13/2024 | -6.4% | -26.0% | -48.4% |
| ... | |||
| SUMMARY STATS | |||
| # Positive | 5 | 5 | 7 |
| # Negative | 20 | 20 | 18 |
| Median Positive | 5.6% | 4.0% | 19.1% |
| Median Negative | -8.3% | -19.3% | -26.7% |
| Max Positive | 15.6% | 7.1% | 284.0% |
| Max Negative | -50.3% | -49.4% | -50.6% |
| Forward Returns | |||
|---|---|---|---|
| Earnings Date | 1D Returns | 5D Returns | 21D Returns |
| 6/25/2026 | -9.9% | -21.4% | -15.2% |
| 2/17/2026 | -2.5% | -3.9% | -5.5% |
| 11/13/2025 | 11.9% | 4.0% | 13.2% |
| 9/10/2025 | -17.0% | -2.6% | 46.3% |
| 6/3/2025 | 1.2% | -5.0% | -21.8% |
| 2/12/2025 | -14.4% | -29.4% | -34.0% |
| 11/13/2024 | -31.8% | -35.5% | 284.0% |
| 8/13/2024 | -6.4% | -26.0% | -48.4% |
| 6/17/2024 | -50.3% | -49.4% | -50.6% |
| 4/12/2024 | -11.1% | -14.7% | 13.4% |
| 11/13/2023 | -3.4% | -21.3% | -37.3% |
| 8/8/2023 | -30.8% | -37.1% | -36.9% |
| 6/6/2023 | -13.8% | -11.8% | -13.0% |
| 2/2/2023 | -7.2% | -18.9% | -39.4% |
| 11/2/2022 | -4.5% | -2.2% | -5.2% |
| 8/4/2022 | -4.6% | -6.2% | -22.7% |
| 6/8/2022 | -2.8% | -21.2% | -34.1% |
| 4/11/2022 | -1.8% | -2.7% | -30.7% |
| 2/9/2022 | -39.0% | -43.0% | -49.5% |
| 11/3/2021 | 15.6% | 6.0% | -12.1% |
| 8/9/2021 | -9.3% | -17.0% | -13.2% |
| 5/26/2021 | -7.4% | -19.7% | -19.8% |
| 1/27/2021 | 5.6% | 2.3% | 19.1% |
| 10/28/2020 | -3.1% | 2.0% | 31.4% |
| 8/5/2020 | 1.4% | 7.1% | 9.1% |
| SUMMARY STATS | |||
| # Positive | 5 | 5 | 7 |
| # Negative | 20 | 20 | 18 |
| Median Positive | 5.6% | 4.0% | 19.1% |
| Median Negative | -8.3% | -19.3% | -26.7% |
| Max Positive | 15.6% | 7.1% | 284.0% |
| Max Negative | -50.3% | -49.4% | -50.6% |
SEC Filings
Expand for More| Report Date | Filing Date | Filing |
|---|---|---|
| 06/30/2026 | 08/11/2026 | 10-Q |
| 03/31/2026 | 06/25/2026 | 10-K |
| 12/31/2025 | 02/17/2026 | 10-Q |
| 09/30/2025 | 11/13/2025 | 10-Q |
| 06/30/2025 | 09/11/2025 | 10-Q |
| 03/31/2025 | 08/26/2025 | 10-K |
| 12/31/2024 | 02/12/2025 | 10-Q |
| 09/30/2024 | 11/14/2024 | 10-Q |
| 06/30/2024 | 08/14/2024 | 10-Q |
| 03/31/2024 | 06/28/2024 | 10-K |
| 12/31/2023 | 09/06/2024 | 10-Q |
| 09/30/2023 | 09/06/2024 | 10-Q |
| 06/30/2023 | 08/08/2023 | 10-Q |
| 03/31/2023 | 06/06/2023 | 10-K |
| 12/31/2022 | 02/02/2023 | 10-Q |
| 09/30/2022 | 11/02/2022 | 10-Q |
| Report Date | Filing Date | Filing |
|---|---|---|
| 06/30/2026 | 08/11/2026 | 10-Q |
| 03/31/2026 | 06/25/2026 | 10-K |
| 12/31/2025 | 02/17/2026 | 10-Q |
| 09/30/2025 | 11/13/2025 | 10-Q |
| 06/30/2025 | 09/11/2025 | 10-Q |
| 03/31/2025 | 08/26/2025 | 10-K |
| 12/31/2024 | 02/12/2025 | 10-Q |
| 09/30/2024 | 11/14/2024 | 10-Q |
| 06/30/2024 | 08/14/2024 | 10-Q |
| 03/31/2024 | 06/28/2024 | 10-K |
| 12/31/2023 | 09/06/2024 | 10-Q |
| 09/30/2023 | 09/06/2024 | 10-Q |
| 06/30/2023 | 08/08/2023 | 10-Q |
| 03/31/2023 | 06/06/2023 | 10-K |
| 12/31/2022 | 02/02/2023 | 10-Q |
| 09/30/2022 | 11/02/2022 | 10-Q |
| 06/30/2022 | 08/04/2022 | 10-Q |
| 03/31/2022 | 06/08/2022 | 10-K |
| 12/31/2021 | 02/09/2022 | 10-Q |
| 09/30/2021 | 11/03/2021 | 10-Q |
| 06/30/2021 | 08/09/2021 | 10-Q |
| 03/31/2021 | 05/26/2021 | 10-K |
| 12/31/2020 | 01/27/2021 | 10-Q |
| 09/30/2020 | 10/28/2020 | 10-Q |
| 06/30/2020 | 08/05/2020 | 10-Q |
| 03/31/2020 | 06/24/2020 | 10-K |
| 12/31/2019 | 01/29/2020 | 10-Q |
| 09/30/2019 | 11/05/2019 | 10-Q |
Recent Forward Guidance
Updated 8/11/2026Latest: Q1 2027 Earnings Reported 8/10/2026
| Forward Guidance | Guidance Change | ||||||
|---|---|---|---|---|---|---|---|
| Metric | Low | Mid | High | % Chg | % Delta | Change | Prior |
| Q2 2027 Revenue | 80.00 Mil | 82.00 Mil | 84.00 Mil | 9.3% | Higher New | Guidance: 75.00 Mil for Q1 2027 | |
| Q2 2027 Non-GAAP adjusted operating expenses | 26.00 Mil | 27.00 Mil | 28.00 Mil | 0 | Same New | Guidance: 27.00 Mil for Q1 2027 | |
| Q2 2027 Non-GAAP adjusted basic net income per share | 0.02 | 0.12 | 0.22 | Higher New | Guidance: -0.15 for Q1 2027 | ||
| Q2 2027 Non-GAAP adjusted EBITDA | 5.00 Mil | 6.00 Mil | 7.00 Mil | 3 | Higher New | Guidance: 1.50 Mil for Q1 2027 | |
Prior: Q2 2026 Earnings Reported 11/13/2025
| Forward Guidance | Guidance Change | ||||||
|---|---|---|---|---|---|---|---|
| Metric | Low | Mid | High | % Chg | % Delta | Change | Prior |
| Q3 2026 Revenue | 65.00 Mil | 67.00 Mil | 69.00 Mil | 9.8% | Higher New | Actual: 61.00 Mil for Q2 2026 | |
| Q3 2026 Non-GAAP adjusted operating expenses | 23.00 Mil | 25.00 Mil | 27.00 Mil | -7.4% | Lower New | Actual: 27.00 Mil for Q2 2026 | |
| Q3 2026 Non-GAAP adjusted basic net loss per share | -0.61 | -0.51 | -0.41 | 96.2% | Lower New | Actual: -0.26 for Q2 2026 | |
| Q3 2026 Non-GAAP adjusted EBITDA | 0 | 1.00 Mil | 2.00 Mil | Higher New | Actual: 0 for Q2 2026 | ||
Insider Activity
Updated 8/5/2026| # | Owner | Title | Holding | Action | Filing Date | Price | Shares | Transacted Value | Value of Held Shares | Form |
|---|---|---|---|---|---|---|---|---|---|---|
| 1 | Craythorne, Anthony | Chief Revenue Officer | Direct | Sell | 8052026 | 10.73 | 1,478 | 15,856 | 145,065 | Form |
| 2 | Nash, Laura A | Chief Accounting Officer | Direct | Sell | 7072026 | 10.51 | 260 | 2,733 | 113,193 | Form |
| 3 | Meyrath, Hugues | President & CEO | Direct | Sell | 7072026 | 10.51 | 6,232 | 65,498 | 1,245,099 | Form |
| 4 | Nash, Laura A | Chief Accounting Officer | Direct | Sell | 4032026 | 5.44 | 109 | 593 | 60,003 | Form |
| 5 | Meyrath, Hugues | President & CEO | Direct | Sell | 10032025 | 10.86 | 2,975 | 32,308 | 268,242 | Form |
| # | Owner | Title | Holding | Action | Filing Date | Price | Shares | Transacted Value | Value of Held Shares | Form |
|---|---|---|---|---|---|---|---|---|---|---|
| 1 | Craythorne, Anthony | Chief Revenue Officer | Direct | Sell | 8052026 | 10.73 | 1,478 | 15,856 | 145,065 | Form |
| 2 | Nash, Laura A | Chief Accounting Officer | Direct | Sell | 7072026 | 10.51 | 260 | 2,733 | 113,193 | Form |
| 3 | Meyrath, Hugues | President & CEO | Direct | Sell | 7072026 | 10.51 | 6,232 | 65,498 | 1,245,099 | Form |
| 4 | Nash, Laura A | Chief Accounting Officer | Direct | Sell | 4032026 | 5.44 | 109 | 593 | 60,003 | Form |
| 5 | Meyrath, Hugues | President & CEO | Direct | Sell | 10032025 | 10.86 | 2,975 | 32,308 | 268,242 | Form |
| 6 | Nash, Laura A | Chief Accounting Officer | Direct | Sell | 10032025 | 10.86 | 611 | 6,635 | 120,970 | Form |
| 7 | Nash, Laura A | Chief Accounting Officer | Direct | Sell | 10032025 | 9.91 | 118 | 1,169 | 116,442 | Form |
| 8 | Nash, Laura A | Chief Accounting Officer | Direct | Sell | 9172025 | 7.40 | 284 | 2,101 | 84,112 | Form |
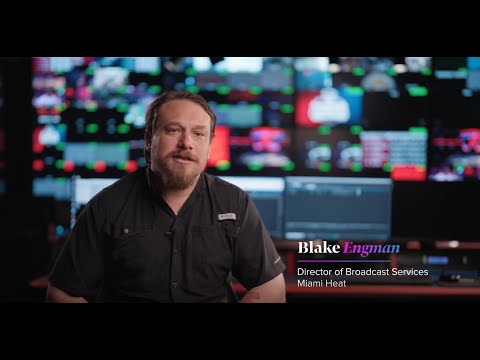
Quantum — Investor Video Playlist



Industry Resources
| Information Technology Resources |
| TechCrunch |
| Wired |
| CIO |
| MIT Technology Review |
| Gartner Insights |
| Ars Technica |
| Technology Hardware, Storage & Peripherals Resources |
| The Verge |
| TechRadar |
| Tom’s Hardware |
| PCMag |
| CNET |
External Quote Links
| Y Finance | Barrons |
| TradingView | Morningstar |
| SeekingAlpha | ValueLine |
| Motley Fool | Robinhood |
| CNBC | Etrade |
| MarketWatch | Unusual Whales |
| YCharts | Perplexity Finance |
| FinViz |
Prefer one of these to Trefis? Tell us why.