How Low Can MSTR Stock Go?

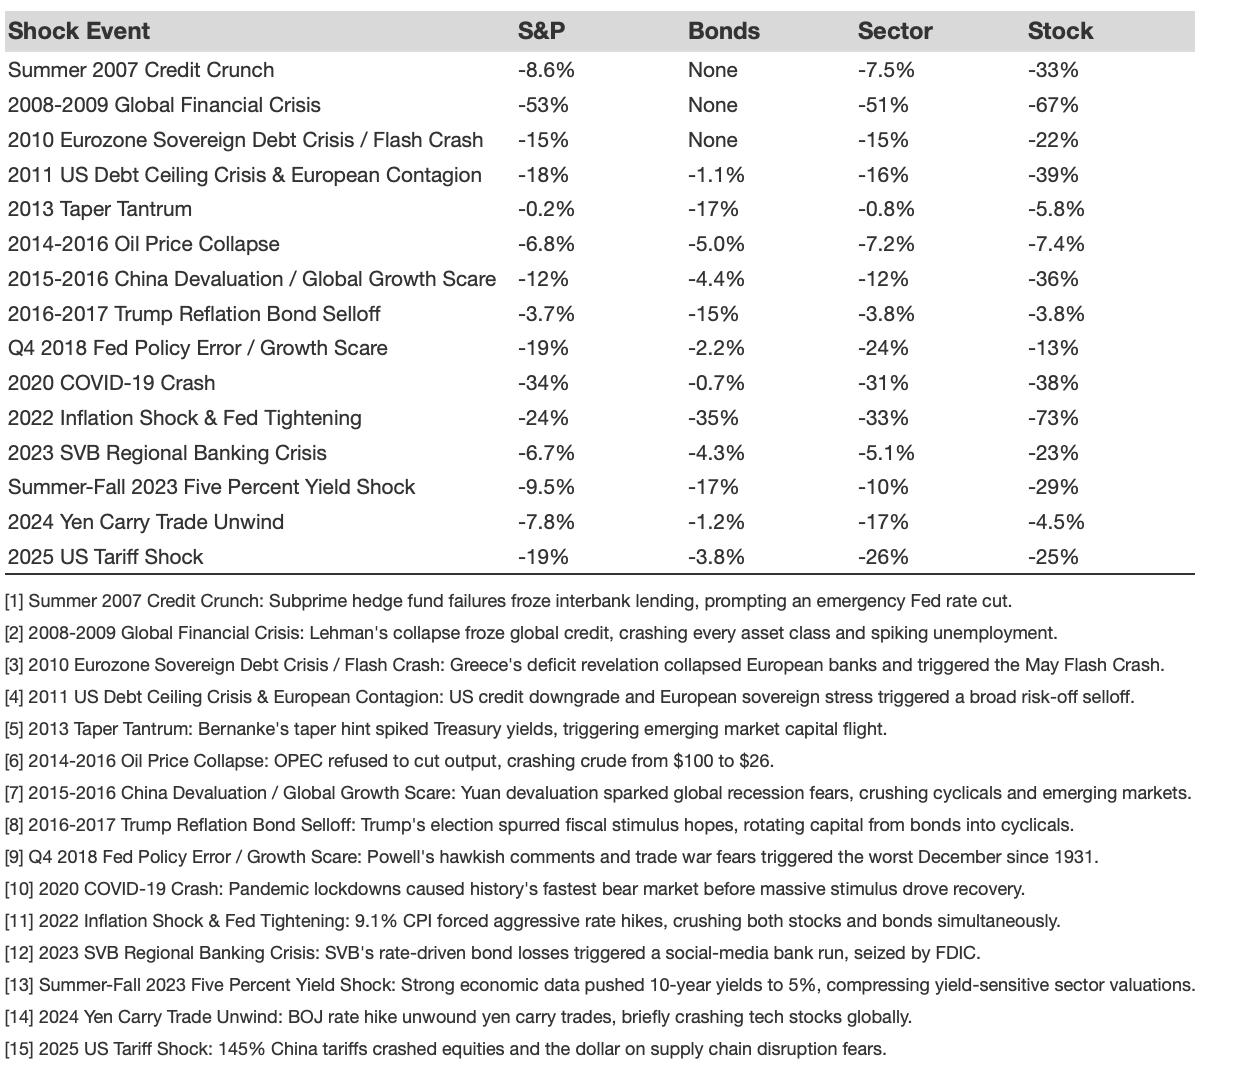
Holding equities means accepting volatility as the price of long-term compounding. Across the 15 major systemic shocks where Strategy (MSTR) traded, the stock posted an average drawdown of -28%. For context, the S&P 500 averaged a -16% decline during those same periods.
Recently, investors have been starkly reminded of this volatility. Over the last month alone, MSTR stock plunged 31% alongside a 22% drop in Bitcoin (BTC). This sharp contraction was driven by a perfect storm of headwinds: high-profile corporate selling, aggressive liquidation cascades, shrinking market liquidity, and persistent, multi-week outflows from U.S. spot ETFs.
If you are an investor in MSTR stock, you might be asking: if the macroeconomic environment fractures, how far can this stock actually fall?
One of the ways to understand this is to simply see how the stock has performed during past market crashes.
- What Are You Really Paying For Inside VOO?
- How Long Bloom Energy Stock Sits Underwater
- The Hidden Engine Behind Elevance Health Stock’s Next Climb
- Reading Between The Lines Of GE Stock’s Latest Call
- Beyond The Sticker Price: What You Are Really Paying For Microsoft Stock
- What Kept Coming Up When Analysts Grilled UNH

Image by Igor Schubin from Pixabay
How Does It Handle Credit And Liquidity Crises?
2008-2009 Global Financial Crisis (Dec 2007 to Mar 2009)
- Excess housing leverage unwound, triggered by Lehman Brothers’ September 15, 2008 bankruptcy. No bailout froze global financial plumbing overnight, shattering assumptions of institutional rescue.
- Commercial paper collapsed and money markets broke the buck. Banks stopped lending as unemployment hit 10%. Oil crashed to $35/bbl on evaporating demand.
MSTR stock experienced a -67% drawdown during this event, compared to -53% for the S&P and None for bonds.
What Happens During Growth And Demand Scare?
2020 COVID-19 Crash (Feb 2020 to Apr 2020)
- A novel coronavirus triggered pandemic fears. Italy’s healthcare collapse and a March 2020 Saudi-Russia oil price war signaled uncontainable disruption.
- Governments shut economies, triggering the fastest bear market in history. Unlimited QE and $2.2T fiscal stimulus drove a V-shaped recovery following vaccine development.
MSTR stock saw a -38% drawdown vs -34% for the S&P and -0.7% for bonds.
How Does It Fare During Sovereign And Geopolitical Risk?
2011 U.S. Debt Ceiling Crisis & European Contagion (Jul 2011 to Oct 2011)
- U.S. political paralysis caused the first S&P AAA credit downgrade on August 5. Simultaneously, Italy and Spain bond yields spiked, raising breakup risks.
- Dysfunction triggered a risk-off flight into Treasuries and gold. European banks faced dollar funding stress, and the Fed reopened currency swap lines to the ECB.
The drawdown for MSTR stood at -39% compared to -18% for the S&P and -1.1% for bonds.
Past Market Shock Drawdowns Summarized For MSTR
So, What Can You Do For Your Investments?
Ultimately, surviving a market crash requires knowing what breaks your specific holdings. For MSTR, the kryptonite is clearly Credit And Liquidity Crises. By sizing your positions with these specific drawdowns in mind, you can remove emotion from the equation entirely.
Adopting objective and rule-based portfolio management is the most effective way to protect capital when the macro environment inevitably fractures again. Trefis High Quality Portfolio is designed with such principles in mind, and has returned over 105% since inception.