How Will Palo Alto Networks Stock React To Its Upcoming Earnings?

The global cybersecurity leader – Palo Alto Networks (NASDAQ:PANW) – is scheduled to report its fiscal Q4 earnings on Monday, August 18 (fiscal ends in July). Historically, the company’s stock has performed well on the day following its earnings announcements. Over the last five years, it has seen a positive one-day return in 65% of instances. The median positive return was 7.7%, and the maximum one-day gain was 18.6%.
While the actual results compared to expectations will be the biggest factor, understanding these historical patterns can give event-driven traders an edge. Here are two main approaches:
- Pre-Earnings Position: You can use historical odds to position yourself in the stock before the earnings release.
- Post-Earnings Position: You can analyze the correlation between immediate and medium-term returns after the earnings are released to guide your trading decisions.
Analysts have a consensus estimate of $0.89 per share in earnings on $2.5 billion in revenue. This is an increase from the same quarter last year, when the company reported earnings of $0.75 per share on $2.19 billion in revenue.
In terms of fundamentals, Palo Alto Networks has a current market capitalization of $112 billion. Over the last twelve months, the company generated $8.9 billion in revenue, with an operating profit of $984 million and a net income of $1.2 billion.
That said, if you seek upside with lower volatility than individual stocks, the Trefis High Quality portfolio presents an alternative — having outperformed the S&P 500 and generated returns exceeding 91% since its inception. Also, see – Bigbear.ai: Sell BBAI Stock At $5?
See earnings reaction history of all stocks

Image by Heinz Schmitz from Pixabay
Palo Alto Networks’ Historical Odds Of Positive Post-Earnings Return
Some observations on one-day (1D) post-earnings returns:
- There are 20 earnings data points recorded over the last five years, with 13 positive and 7 negative one-day (1D) returns observed. In summary, positive 1D returns were seen about 65% of the time.
- However, this percentage decreases to 58% if we consider data for the last 3 years instead of 5.
- Median of the 13 positive returns = 7.7%, and median of the 7 negative returns = -3.7%
Additional data for observed 5-Day (5D) and 21-Day (21D) returns post earnings are summarized along with the statistics in the table below. Related – Fortinet: FTNT Stock To $150?
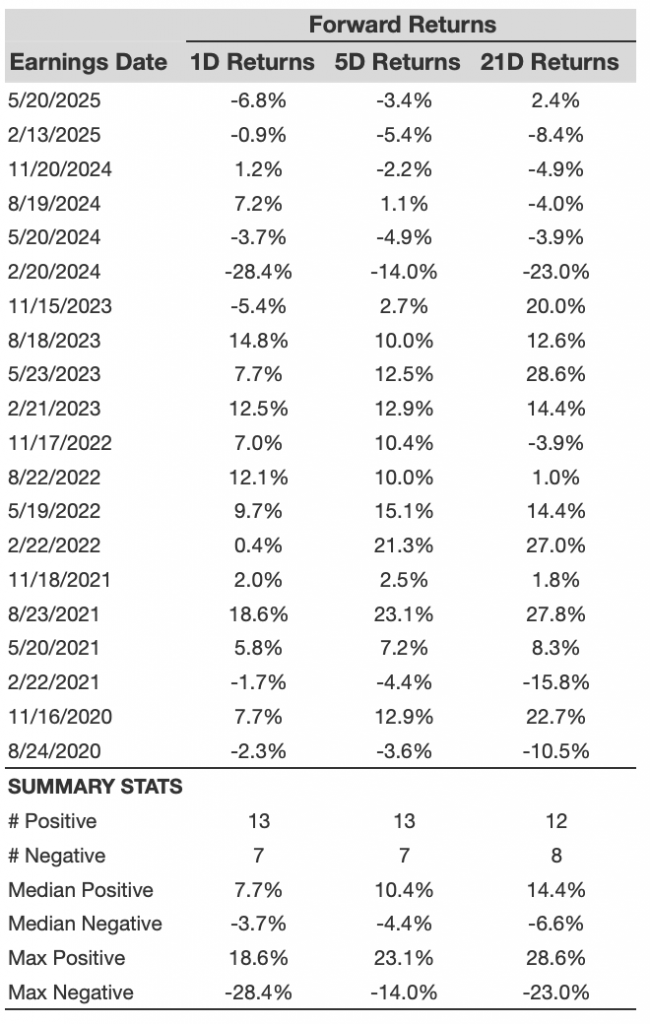
PANW 1D, 5D, and 21D Post Earnings Return
Correlation Between 1D, 5D, and 21D Historical Returns
A relatively less risky strategy (though not useful if the correlation is low) is to understand the correlation between short-term and medium-term returns post earnings, find a pair that has the highest correlation, and execute the appropriate trade. For example, if 1D and 5D show the highest correlation, a trader can position themselves “long” for the next 5 days if the 1D post-earnings return is positive. Here is some correlation data based on a 5-year and a 3-year (more recent) history. Note that the correlation 1D_5D refers to the correlation between 1D post-earnings returns and subsequent 5D returns. Also, see – Buy or Sell PANW Stock?
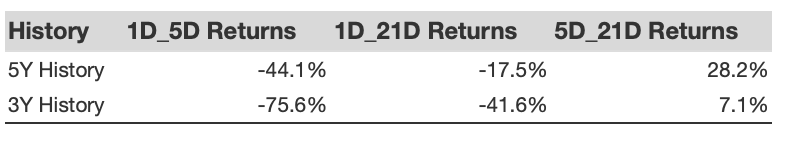
PANW Correlation Between 1D, 5D and 21D Historical Returns
Is There Any Correlation With Peer Earnings?
Sometimes, peer performance can have an influence on post-earnings stock reaction. In fact, the pricing-in might begin before the earnings are announced. Here is some historical data on the past post-earnings performance of Palo Alto Networks stock compared with the stock performance of peers that reported earnings just before Palo Alto Networks. For fair comparison, peer stock returns also represent post-earnings one-day (1D) returns.
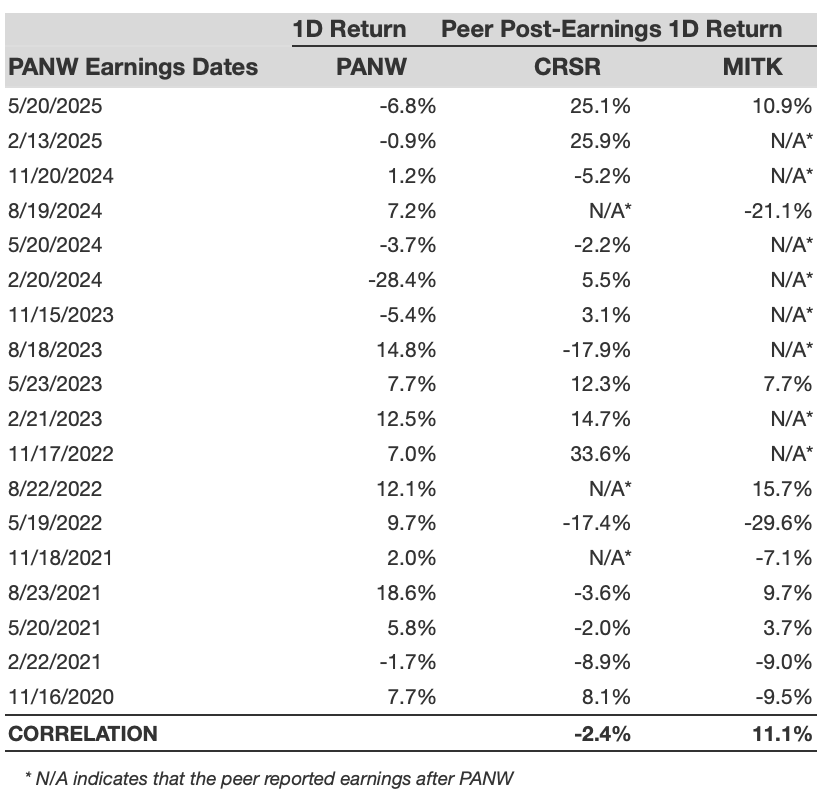
PANW Correlation With Peer Earnings
Learn more about Trefis RV strategy that has outperformed its all-cap stocks benchmark (combination of all 3, the S&P 500, S&P mid-cap, and Russell 2000), to produce strong returns for investors. Separately, if you want upside with a smoother ride than an individual stock like Palo Alto Networks, consider the High Quality portfolio, which has outperformed the S&P and clocked >91% returns since inception.
Invest with Trefis Market-Beating Portfolios
See all Trefis Price Estimates