Taking a Look at Warren Buffett’s Favorite Macro Indicator

Submitted by Sizemore Insights as part of our contributors program
Taking a Look at Warren Buffett’s Favorite Macro Indicator
by Charles Lewis Sizemore, CFA
- IQOS Helps Philip Morris Navigate Well In Q1
- Down 45% Year To Date, What’s Happening With Sirius Stock?
- Meta Platforms Stock Dropped 10.6% In A Day, What’s Next?
- What Factors Will Drive Pfizer’s Q1 Performance?
- A Rebound In Asia Travel Will Likely Drive Estée Lauder’s Q3 Performance
- Higher Medical Costs Likely Weighed On CVS Health’s Q1 Earnings

Warren Buffett hasn’t been in his A game over the past couple years. It’s too early to say how his most recent large acquisition – Precision Castparts – will end up performing. But his last major stock market buy – IBM (IBM) – has been such a lousy performer, we actually shorted it in Boom & Bust.
Ouch.
All the same, Mr. Buffett is still a living legend, and his market calls have usually been pretty prescient. Today, we’re going to look at the valuation tool he has repeatedly called “probably the best single measure of where valuations stand at any given moment.”
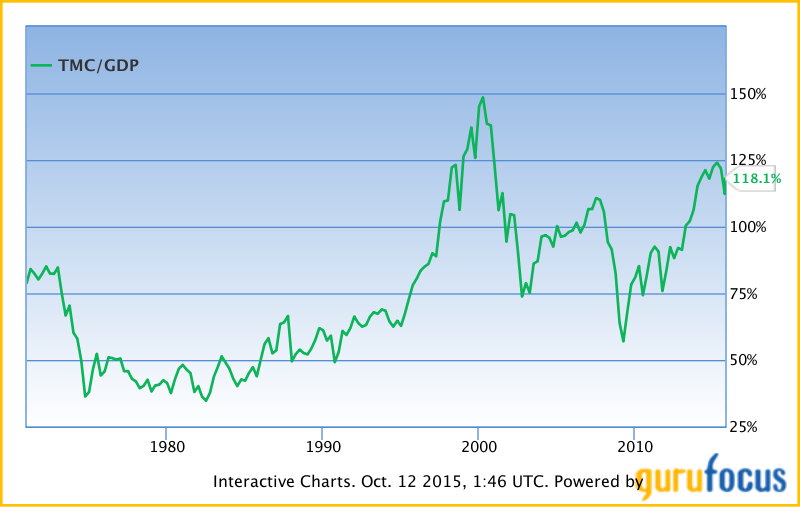
And that would be the ratio of total market cap to U.S. GDP. Data site GuruFocus tracks the data back to 1970 using the Wishire 5000 as a proxy for the “total” market cap.
So, how’s it looking? After the third-quarter correction, might stocks be at least modestly cheap?
Not a chance.
U.S. stocks are valued at 118% of GDP. That’s down from the highs earlier this year of 125% and certainly a far cry from the 148% we saw during the “nutty looney” extremes of the 1990s tech bubble. But it’s still extremely expensive. The ratio would have to drop by another 8% just to get back to the levels of 2007 . . . before the 2008 meltdown started.
So suffice it to say, the market is far from cheap. And that implies lousy returns for the next several years. Let’s dig into the numbers.
Investment returns are a product of three factors: Dividend yield, economic growth and change in valuation. None of the three look great right now. Market dividend yields are a puny 2% these days, and GDP growth has been pretty uninspiring. A 2% dividend and 2% – 3% economic growth would get us to 4% – 5% stock returns. While not exciting, that’s not a terrible return in this interest rate environment.
But then we get to valuation. Assuming that the market returns to its long-term average market-cap-to-GDP ratio, we’re looking at lean years ahead. GuruFocus crunched the numbers, and based on current valuations the market should return a measly 0.5% per year over the next eight years.
Now, a lot can happen in eight years. But it’s safe to say that the odds are not in your favor right now if you’re a buy-and-hold investor. If you want to earn a respectable return over the next several years, you’re going to need to be a lot more active and consider strategies you might have never considered before.
Note: In light of the market’s volatility, it’s never a bad idea to give your asset allocation a second look. If you are an accredited investor, please contact my office. I have several solid alternative funds offering “stock like” returns but with virtually no correlation to the stock market. They make for nice portfolio diversifiers and present a nice alternative to expensive stocks.
Photo credit: DonkeyHotey
This article first appeared on Sizemore Insights as Taking a Look at Warren Buffett’s Favorite Macro Indicator