
How Has Capital One’s Loan Loss Figure Changed Over The Last Five Years?
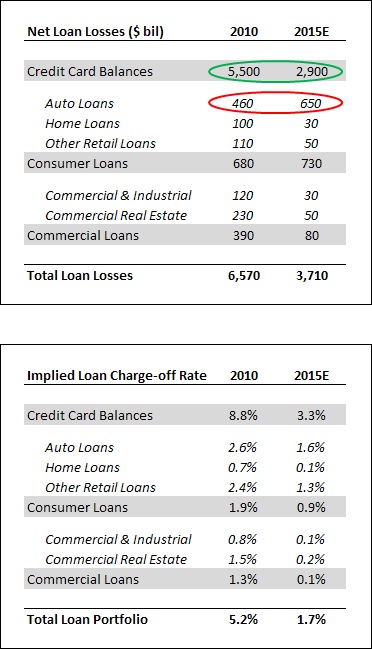
See the links below for more information and analysis about Capital One:
- What Proportion of Capital One’s Revenues & Profits Come From Its Various Divisions?
- What Is Capital One’s Fundamental Value Based On Expected 2015 Results?
- How Much Are Capital One’s Operating Divisions Worth Individually?
- What Is The Constitution Of Capital One’s Loan Book In Terms Of Loan Categories?
- How Has Capital One’s Loan Portfolio Changed Over The Last Five Years?
- How Much Did Each Loan Category Contribute Towards Capital One’s Total Loan Losses In 2015?
Notes:
1) The purpose of these analyses is to help readers focus on a few important things. We hope such lean communication sparks thinking, and encourages readers to comment / ask questions on the comments section
2) Figures mentioned are approximate values to help our readers remember the key concepts more intuitively. For precise figures, please refer to the full Trefis analysis for Capital One
[trefis_slideshow ticker=”COF” rhs=”3″]
View Interactive Institutional Research (Powered by Trefis):
Global Large Cap | U.S. Mid & Small Cap | European Large & Mid Cap
More Trefis Research