
Why Pay More For Exxon Mobil Stock Than Chevron?
For questions about this article or underlying research, email help@trefis.com.
Exxon Mobil (XOM) stock costs more for each dollar of profit than any of five oil and gas peers, a group ranging from Chevron to the refiner Valero Energy. Over its latest four quarters, however, Exxon grew sales more slowly than four of those companies and kept a thinner operating margin than three of them. So how much extra are you paying for Exxon, set beside the rival closest to it?
Exxon Costs More Than Chevron Yet Grew Less
Exxon trades at 17.0 times its earnings over the four quarters ended September 30, 2026, compared with 15.8 times for Chevron. Because both are integrated oil and gas companies, Chevron offers a fair comparison. Over those same four quarters, Chevron grew revenue 20.8%, outpacing the 19.5% growth at Exxon. Chevron also turned 14.6% of its sales into operating profit, beating Exxon’s 12.4%. You therefore pay more for each dollar of Exxon’s profit, while Chevron grew faster and kept more of each sales dollar.
Every other company in the group costs less per dollar of profit than Exxon. Only ConocoPhillips grew more slowly, at 13.3%, and its stock trades at a cheaper 14.5 times earnings. Because the oil producers and the refiners run different businesses from Exxon, their margins say less about it than Chevron’s margins do.
| XOM | CVX | COP | OXY | MPC | VLO | |
|---|---|---|---|---|---|---|
| Four Fiscal Quarters | ended 2026-09-30 (Q4 FY2025 to Q3 FY2026) | ended 2026-09-30 (Q4 FY2025 to Q3 FY2026) | ended 2026-09-30 (Q4 FY2025 to Q3 FY2026) | ended 2026-09-30 (Q4 FY2025 to Q3 FY2026) | ended 2026-09-30 (Q4 FY2025 to Q3 FY2026) | ended 2026-09-30 (Q4 FY2025 to Q3 FY2026) |
| Market Value (USD billion) | 691 | 425 | 168 | 57.4 | 112 | 105 |
| P/E | 17 | 15.8 | 14.5 | 7 | 7.7 | 8.1 |
| Revenue Growth | 19.5% | 20.8% | 13.3% | 34.7% | 31.2% | 24.6% |
| Operating Margin | 12.4% | 14.6% | 24.7% | 29.3% | 11.4% | 11.5% |
| Total Return, Incl. Dividends, 2025-11-13 to 2026-11-16 | 45.5% | 45.1% | 63.2% | 39.2% | 110.1% | 114.8% |
What Do You Get For Exxon’s Higher Price?
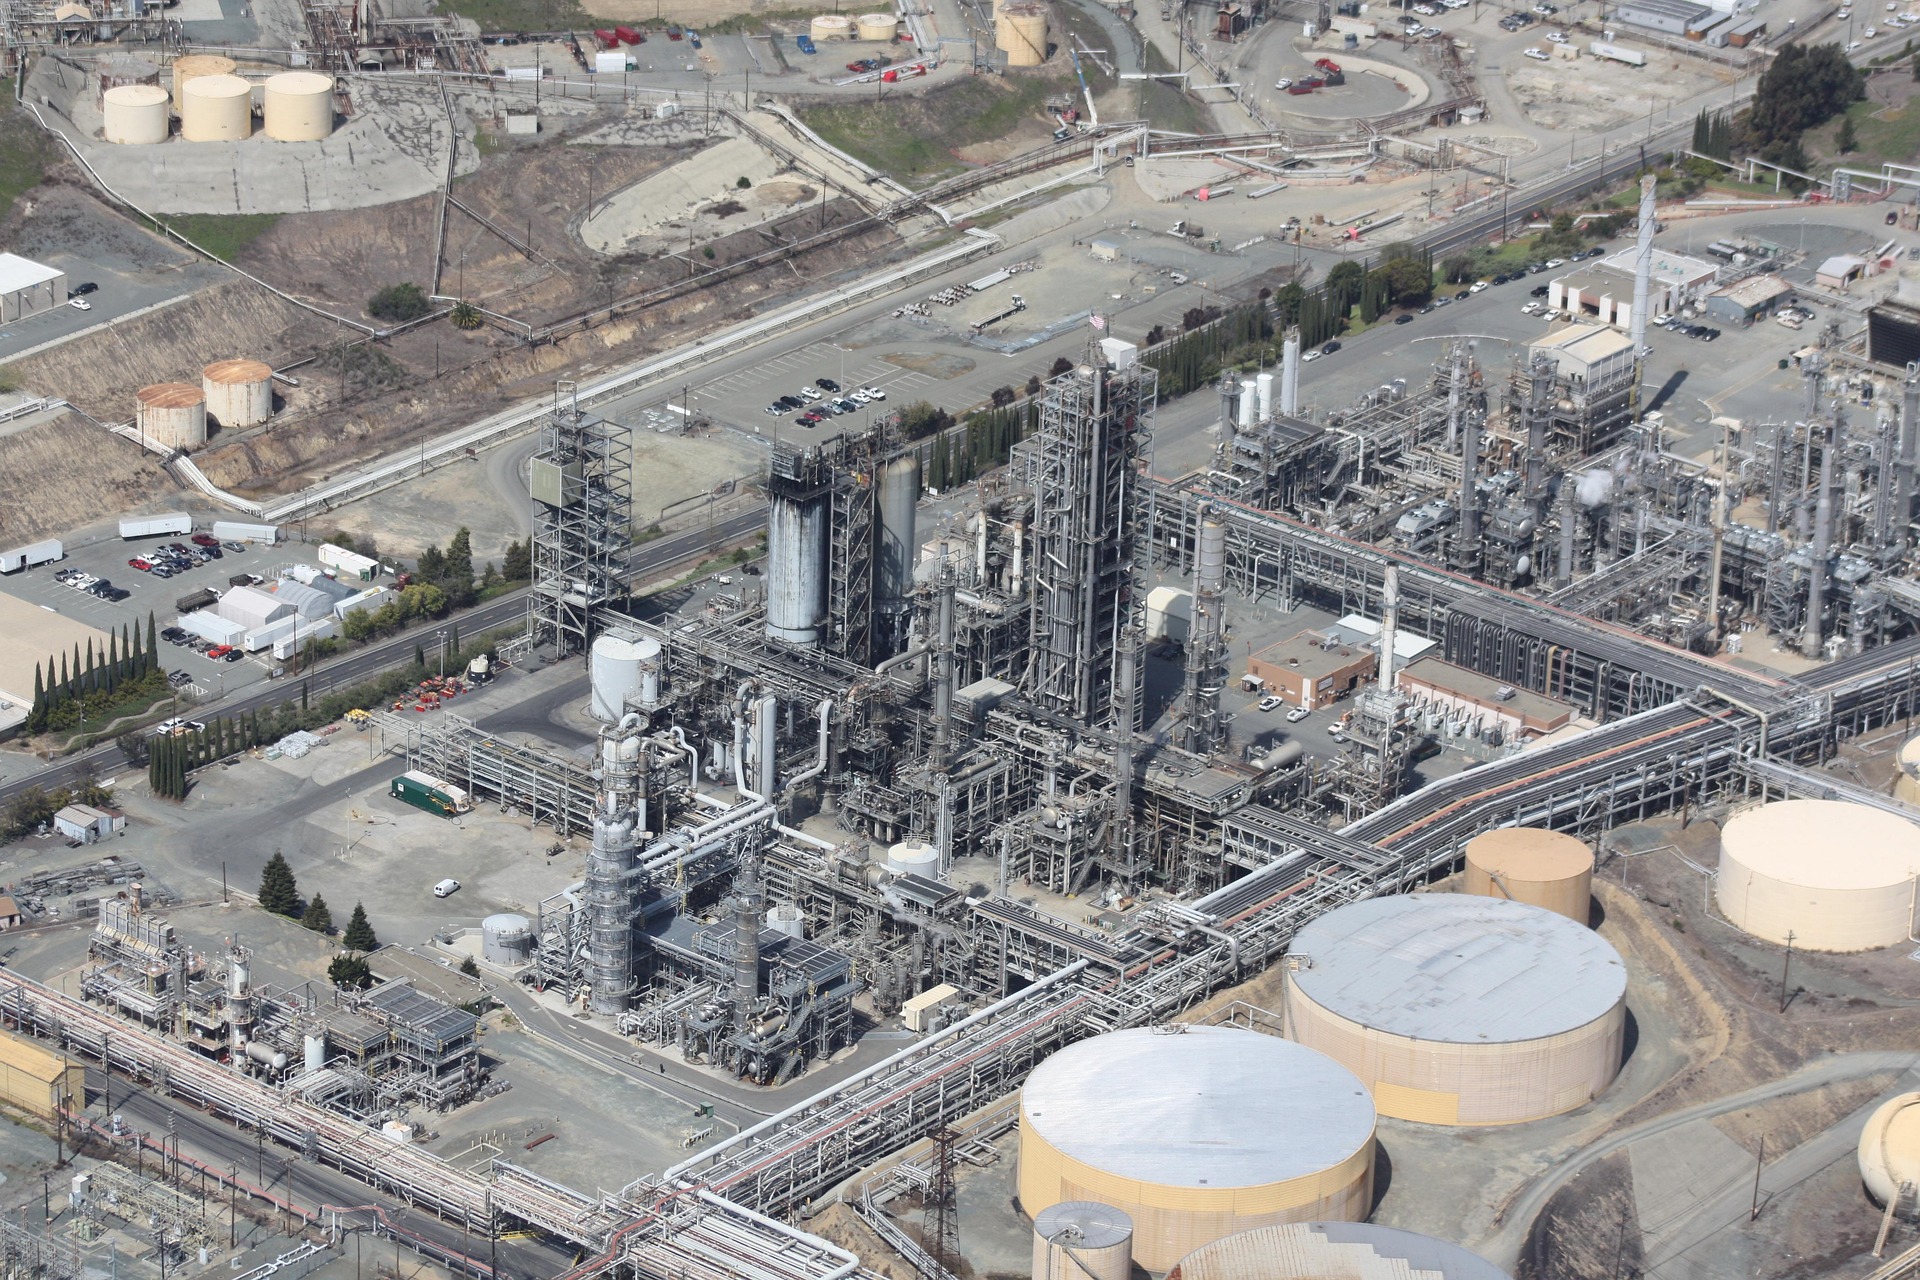
You get one of the world’s biggest fuel businesses. Exxon’s Energy Products segment brought in $290 billion of its $324 billion revenue in fiscal 2025. That segment figure can include sales between Exxon’s own businesses. Management calls Exxon the largest nonstate-owned refiner in the world, running about 3.6 million barrels of crude a day through its refineries.
Exxon’s total sales had an uneven year. Exxon’s revenue grew 2.6% from a year earlier in fiscal Q1 2026 and 32.6% in fiscal Q3 2026. The third quarter was also when, management said, conflict in the Middle East constrained supplies of crude, diesel and gasoline, and the lack of supply led to higher market prices.
Buyers may be paying extra for something steadier: a long record of rewarding shareholders. On October 30, 2026, management announced a 4% dividend increase, marking its 44th consecutive year of dividend growth.
What Exxon Plans For 2027
Management plans to keep share repurchases at $20 billion in 2027, assuming reasonable market conditions. The company has also cut $16.9 billion of structural costs since 2019, toward a goal of $20 billion by 2030. The buyback plan was set while fuel was in short supply, and management said on the same call that it expects markets to take well through 2027 to get back closer to normal, possibly longer.
So the price appears to assume Exxon can keep its profit and its payouts up once fuel markets settle. Its dividend record shows it has kept raising payouts through earlier downturns, but the four quarters behind today’s price end with a quarter of short supply, so they cannot show that yet. Exxon’s operating margin is the measure to watch in its fourth-quarter report, expected in January 2027.
Even the largest company in a group can trail its rivals for a year. That reality remains a good reason to spread your money across many strong businesses rather than lean on just one.
Why Own One Leader When You Can Own 30?
If you like finding quality companies like Exxon Mobil, the Trefis High Quality (HQ) Portfolio holds 30 of them in equal weight, and has returned more than 105% since its September 2020 launch. You’re welcome to look inside.
Spot an error or want more like this? Tell us in 10 seconds.