How Will Walmart Stock React To Its Upcoming Earnings?

[Note: Walmart’s Fiscal Year 2025 ended on January 31, 2025]
Walmart (NYSE: WMT) is scheduled to release its fiscal second-quarter earnings on Thursday, August 21, 2025, with analysts projecting earnings of 74 cents per share on $174.25 billion in revenue. This would represent a 10% year-over-year increase in adjusted earnings and a 3% increase in sales compared to the prior year’s figures of 63 cents per share and $161.51 billion in revenue. Historically, WMT stock has increased 53% of the time following earnings announcements with a median one-day rise of 3.6% and a maximum observed increase of 7%.
Trade remains a key swing factor. About a third of Walmart’s U.S. merchandise is imported, with China, Mexico, Canada, Vietnam, and India among its largest sourcing markets. Tariffs on Chinese goods, particularly in categories like toys and electronics, continue to represent the greatest cost pressure. Walmart remains the world’s retail heavyweight, but tariffs, particularly on Chinese imports, could shape the outlook ahead. The second-quarter report should offer more clarity on how those costs are being managed.
The company has $800 Bil in current market capitalization. Revenue over the last twelve months was $685 Bil, and it was operationally profitable with $30 Bil in operating profits and net income of $19 Bil. While a lot will depend on how results stack up against consensus and expectations, understanding historical patterns might just turn the odds in your favor if you are an event-driven trader.
For event-driven traders, historical patterns may offer an edge, whether by positioning ahead of earnings or reacting to post-release moves. That said, if you seek upside with lower volatility than from individual stocks, the Trefis High Quality portfolio presents an alternative, having outperformed the S&P 500 and generated returns exceeding 91% since its inception. See earnings reaction history of all stocks.

Photo by Alexas_Fotos on Pixabay
Walmart’s Historical Odds Of Positive Post-Earnings Return
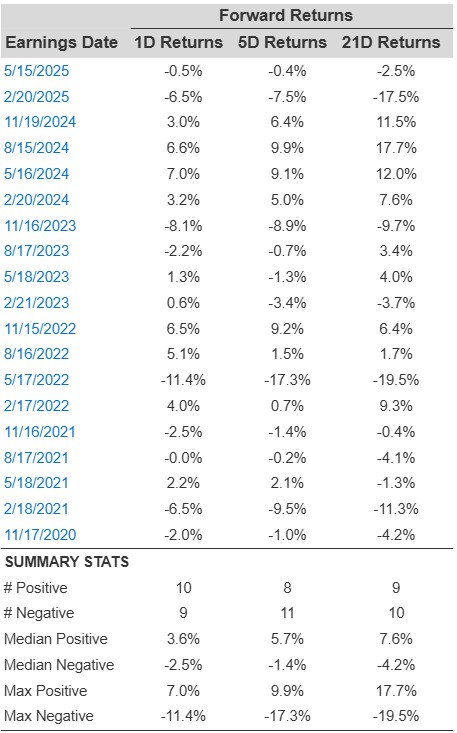
Some observations on one-day (1D) post-earnings returns:
- There are 19 earnings data points recorded over the last five years, with 10 positive and 9 negative one-day (1D) returns observed. In summary, positive 1D returns were seen about 53% of the time.
- Notably, this percentage increases to 64% if we consider data for the last 3 years instead of 5.
- Median of the 10 positive returns = 3.6%, and median of the 9 negative returns = -2.5%
Additional data for observed 5-Day (5D) and 21-Day (21D) returns post earnings are summarized along with the statistics in the table below.
WMT Correlation Between 1D, 5D, and 21D Forward Returns
Correlation Between 1D, 5D, and 21D Historical Returns
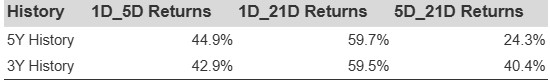
A relatively less risky strategy (though not useful if the correlation is low) is to understand the correlation between short-term and medium-term returns post earnings, find a pair that has the highest correlation, and execute the appropriate trade. For example, if 1D and 5D show the highest correlation, a trader can position themselves “long” for the next 5 days if 1D post-earnings return is positive. Here is some correlation data based on 5-year and 3-year (more recent) history. Note that the correlation 1D_5D refers to the correlation between 1D post-earnings returns and subsequent 5D returns.
WMT Correlation Between 1D, 5D and 21D Historical Returns
Is There Any Correlation With Peer Earnings?
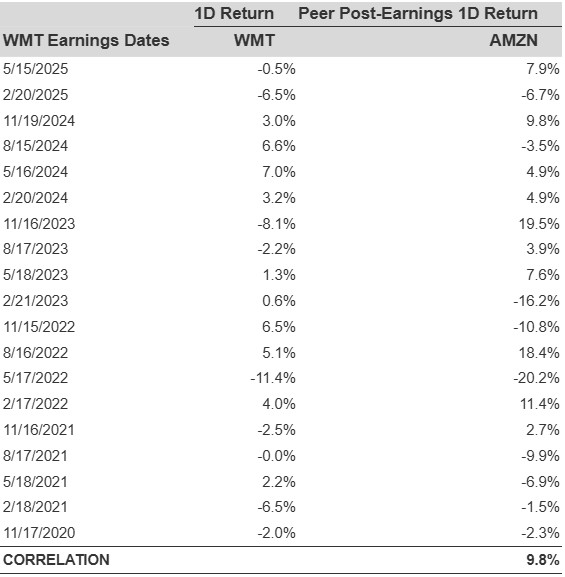
Sometimes, peer performance can have influence on post-earnings stock reaction. In fact, the pricing-in might begin before the earnings are announced. Here is some historical data on the past post-earnings performance of Walmart stock compared with the stock performance of peers that reported earnings just before Walmart. For fair comparison, peer stock returns also represent post-earnings one-day (1D) returns.
WMT Correlation With Peers
Learn more about Trefis RV strategy that has outperformed its all-cap stocks benchmark (combination of all 3, the S&P 500, S&P mid-cap, and Russell 2000), to produce strong returns for investors.
Invest with Trefis Market-Beating Portfolios