
Is The Market Pricing TJX Companies Fairly?
The largest off-price retailer, TJX Companies (NASDAQ: TJX), has performed modestly over the past couple of years, with around 8% annual growth in revenue and a 5% jump in the stock price in between FY 2016-2018 (fiscal year ends in February). The growth was largely due to a 6% increase in the number of stores and 2% increase in overall comp sales, driven primarily by an increase in customer traffic in all four segments. We expect another strong year for TJX, driven primarily by strong sales trends and increased U.S. customer confidence.
We have created an interactive dashboard analysis to estimate TJX’s valuation based on its expected results for fiscal 2019. You can modify the key value drivers to see how they impact the company’s revenues, bottom line, and valuation.
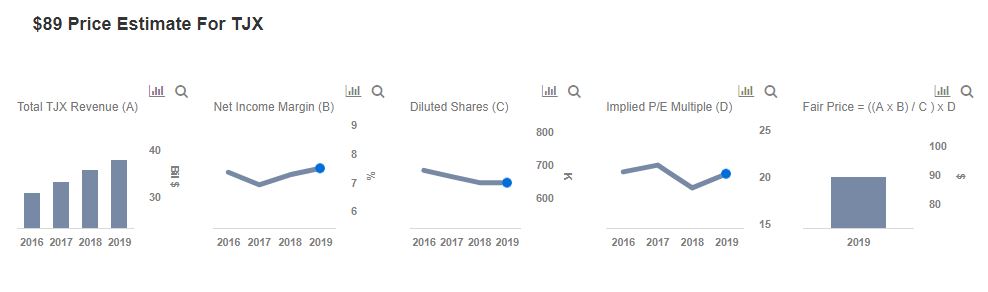
We have an $89 price estimate for TJX’s stock, which is nearly 10% ahead of the market price, based on revenue projections of $37.8 billion for FY 2019, a net margin of about 7.5%, and a P/E multiple of 20x, which is slightly more 2018 levels but still lower than the industry average.
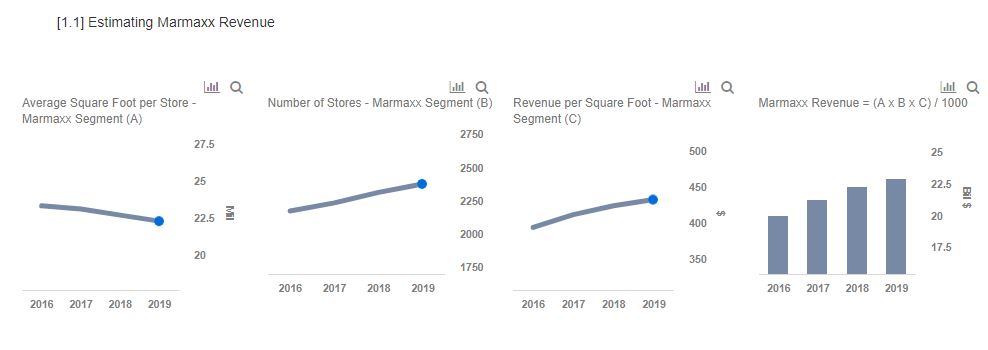
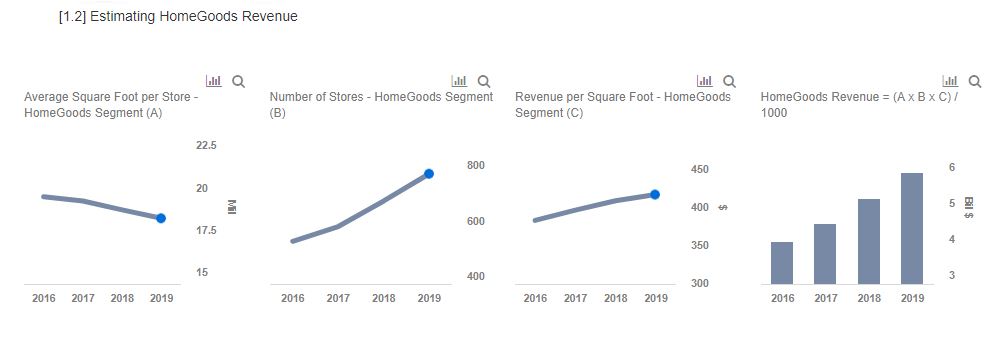
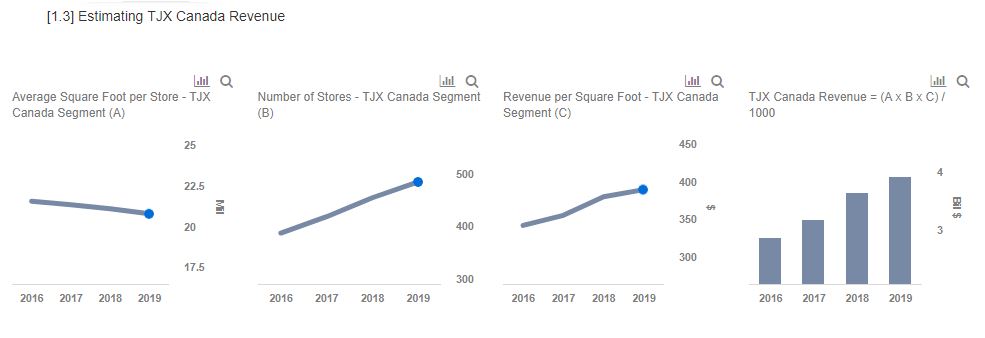
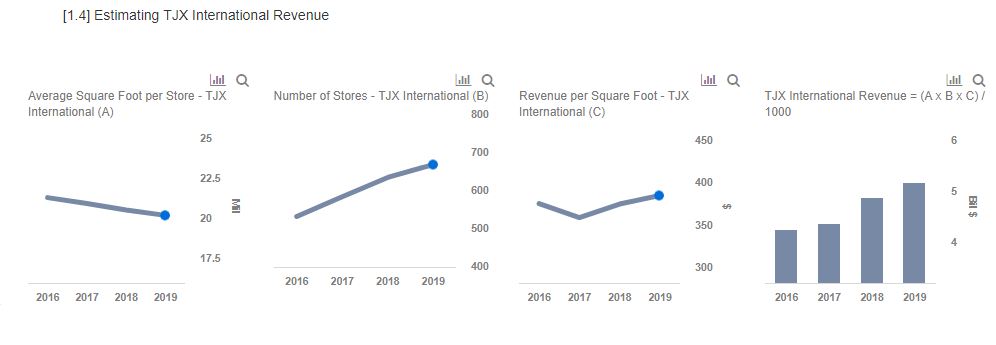
We are upbeat about TJX’s growth prospects for FY 2019, driven by the improved outlook of the retail sector and increased U.S. customer confidence. We believe the revenue growth can be sustained through FY 2019, driven by the scaling of the Maramaxx, HomeGoods, and Trade Secret business, slightly offset by wage increases. In addition, TJX’s ability to improve comp sales, add new stores, and invest in technology should offer strong domestic and international growth. Further, expansion into newer European markets should provide long-term growth opportunities.
What’s behind Trefis? See How it’s Powering New Collaboration and What-Ifs
For CFOs and Finance Teams | Product, R&D, and Marketing Teams
Like our charts? Explore example interactive dashboards and create your own.