The Great Debt Divide: Government vs. The Tech Giants

Imagine two financial superpowers: one, an ancient, sprawling government entity, and the other, a fleet of agile, modern-day tech empires. Each is a dominant force in the global economy, yet they approach money and risk in fundamentally opposite ways. For years, financial headlines have been dominated by the ballooning national debt, often framed as an existential threat to the U.S. economy. Simultaneously, we’ve watched a handful of American technology companies achieve unprecedented valuations, essentially becoming the most valuable businesses in world history.
This creates a peculiar economic split: the public sector, which is meant to provide a stable foundation, is heavily leveraged, while the private sector’s crown jewels maintain extraordinarily pristine balance sheets. This analysis dives into the sheer scale of this difference, contrasting the U.S. government’s massive debt-to-GDP ratio with the near-zero leverage of tech’s “Big Five” – NVIDIA, Alphabet, Microsoft, Apple, and Amazon. The comparison isn’t meant to be perfectly apples-to-apples, as governments and corporations play by different rules. Instead, it serves as a powerful illustration of where risk and financial conservatism are currently concentrated in the American economic landscape.
Speaking of financial conservatism and high-quality returns, if you seek an upside with less volatility than holding an individual stock, consider the Trefis High Quality Portfolio. It has comfortably outperformed its benchmark—a combination of the S&P 500, Russell, and S&P MidCap indexes—and has achieved returns exceeding 105% since its inception.

Image by Horst Schwalm from Pixabay
- The Real Engine Behind Apple Stock’s Next Potential Climb
- Mastercard Stock And The Number Behind The Worry
- Worried About Amazon’s AI Bill? What If It’s Already Paid For?
- Caterpillar’s Margin Problem: Is the Core Business Losing Steam?
- The $50B Plan Merck Stock Was Broadcasting
- Marvell Stock And The Custom Chip Story The Market Underestimated
Part 1: The Debt-to-Equity Story
The difference in financial strategy couldn’t be more pronounced.
The U.S. government operates with roughly $35 trillion in debt. That’s roughly 21% of its household net wealth (the country’s equivalent of “equity”) of around $167 trillion. Here’s where it gets interesting: that’s exactly the median S&P 500 company’s debt-to-equity ratio of 21%. In other words, the United States is essentially being run like a middling S&P 500 company from a balance sheet perspective.
Now, look at America’s largest tech companies: they’re essentially debt-free, especially when you compare their debt to their total value. Their debt-to-equity ratios are astonishingly low:
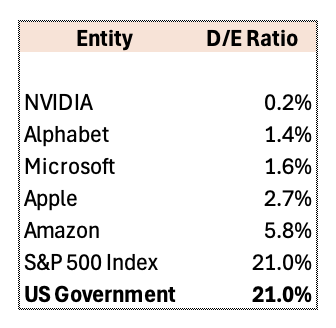
Debt To Equity Ratio
To truly grasp this, consider the median S&P 500 company, which operates with a 21% debt-to-equity ratio. That benchmark represents a standard, moderate use of debt. The Big Five aren’t just a little below the median; they’re in a completely different ballpark. This highlights a remarkable financial conservatism, suggesting these giants are cash-rich and deeply risk-averse.
Part 2: The Debt-to-Revenue Comparison
The U.S. government operates with debt that’s roughly 120–125% of its GDP. Think of this like a homeowner with a mortgage that’s more than the total value of their house in a year — it’s a massive commitment.
Now compare that to the tech giants’ debt-to-revenue ratios:
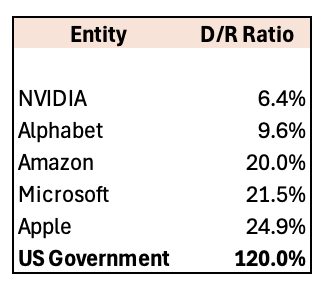
D/R Ratio: Debt-to-revenue ratio | Debt to GDP Ratio for the US Divernment
The contrast is even more dramatic here. While the government’s debt is notably more than its GDP, these tech companies carry debt equal to less than 25% of their annual revenue. NVIDIA and Alphabet’s ratios are particularly striking—their debt represents just a few weeks’ worth of revenue.
This reveals just how robust these tech balance sheets really are. They’ve built business models that generate enormous cash flows while requiring minimal debt financing.
Part 3: The Cost of Borrowing
There’s another layer to this story: what does it actually cost to borrow?
The U.S. government currently pays approximately 4% on 10-year Treasury bonds. That’s considered the “risk-free rate” since the U.S. has never defaulted on its debt and can theoretically print dollars to pay creditors.
Meanwhile, the effective interest rates for these tech companies (the actual average rate they pay across all their debt) are generally lower than what the government pays:
- Most of these companies can borrow at rates comparable to or below Treasuries
- Their strong credit ratings and cash positions give them exceptional borrowing power
- Some corporate bonds from these firms actually trade at lower yields than government debt
This creates a somewhat paradoxical situation: the companies are so financially strong that they pay less to borrow money than the government that backs the currency, yet they choose to borrow very little. Meanwhile, the government borrows heavily despite paying a premium.
Why This Debt Gap Matters
This profound financial split creates a fascinating economic dynamic, mainly because the two sectors rely on each other.
The Risk-Transfer Dynamic
It’s highly unusual for the nation’s most valuable companies to have shunned the typical business practice of using debt for growth and expansion, especially when the government’s debt-to-GDP ratio far exceeds typical corporate leverage levels.. In essence, the public sector is shouldering the vast majority of the financial risk. Meanwhile, these powerful private companies — who benefit enormously from government-funded infrastructure, education, and research — maintain pristine balance sheets. The government carries the debt burden that helps create a stable, innovative environment where tech companies can thrive and generate mountains of cash.
Systemic Risk Concentration
There’s also a big-picture, systemic angle here. Since these tech firms represent a huge portion of the entire stock market’s value yet carry minimal debt, it implies that the financial system’s leverage is concentrated elsewhere. Where? Primarily in government bonds. These bonds are the foundation of global finance, underpinning everything from bank reserves to pension funds. If the riskiest entity is the one whose stability the entire system relies on, it shifts the nature of systemic risk.
Where the Comparison Breaks Down
We have to be careful, though, because comparing the government to a corporation is like comparing a national park to a private yacht: they’re fundamentally different.
- The Power to Print: The U.S. government can do things a company can’t — namely, it can print its own currency and collect taxes indefinitely. Even a dominant player like NVIDIA could theoretically go bankrupt, but the U.S. Treasury, for all its debt, cannot.
- Different Goals and Time Frames: Government debt often serves a counter-cyclical purpose, allowing for more spending during recessions when private companies are pulling back. Corporate debt, conversely, is usually taken on to specifically boost shareholder returns. Furthermore, companies optimize for quarterly earnings and competitive advantage, while governments (ideally) invest in long-term societal benefits that may take decades to show a return.
The Bottom Line
These incredibly low corporate debt ratios are a reflection of two things: the nearly unmatched cash-generating power of dominant tech platforms and a cautious approach in an increasingly uncertain global economic landscape. Meanwhile, the high government debt is the result of decades of complex policy choices about the state’s role in the economy — whether it’s funding wars, social security, or massive infrastructure projects.
Neither financial state is inherently better or worse than the other; they’re just different financial tools designed for completely different purposes. It simply creates a dynamic where the nation’s biggest private sector winners are risk-averse, while the public sector is effectively running the country on a major credit tab.
For the individual investor navigating this bifurcated financial landscape, this environment presents both opportunity and risk. Specifically, investing in a single stock without comprehensive analysis can be risky when market leadership is so concentrated and economic signals are mixed. This is why a diversified, systematic approach is crucial.
For instance, consider the Trefis Reinforced Value (RV) Portfolio, which has outperformed its all-cap stocks benchmark (a combination of the S&P 500, S&P mid-cap, and Russell 2000 benchmark indices) to produce strong returns for investors. This success stems from its methodical, quarterly rebalanced mix of large-, mid-, and small-cap RV Portfolio stocks, which provides a responsive way to make the most of upbeat market conditions while limiting losses when markets head south, as detailed in the RV Portfolio performance metrics. This systematic strategy offers a counterbalance to the volatility created by the stark financial differences between the cautious corporate giants and the credit-dependent public sector.
Invest with Trefis Market-Beating Portfolios
See all Trefis Price Estimates