How To Trade Synopsys Stock Ahead of Its Upcoming Earnings?

Software company Synopsys (NASDAQ: SNPS) is scheduled to report its earnings on Tuesday, September 9, 2025. For event-driven traders, understanding historical patterns can provide a strategic advantage. This data can be used in two ways: either by positioning yourself before the earnings release based on historical trends or by trading after the announcement by analyzing the correlation between immediate and medium-term returns.
Over the past five years, Synopsys’ stock has shown a negative one-day return in 53% of instances following an earnings announcement. The median negative return was -3.1%, with the largest one-day drop being -12.4%.
For the upcoming quarter, the consensus estimates are for earnings of $3.75 per share on sales of $1.77 billion. This is an increase from the same quarter last year, which saw earnings of $3.43 per share on sales of $1.53 billion.
Currently, the company has a market capitalization of $113 billion. In the last twelve months, it generated $6.2 billion in revenue, with an operating profit of $1.3 billion and a net income of $2.2 billion.
That being said, if you seek an upside with less volatility than holding an individual stock, consider the High Quality Portfolio. It has comfortably outperformed its benchmark—a combination of the S&P 500, Russell, and S&P MidCap indexes—and has achieved returns exceeding 91% since its inception. Separately, see – GOOG Stock To $400?
See earnings reaction history of all stocks

Image by SoftRadix Technologies from Pixabay
Synopsys’ Historical Odds Of Positive Post-Earnings Return
Some observations on one-day (1D) post-earnings returns:
- There are 19 earnings data points recorded over the last five years, with 9 positive and 10 negative one-day (1D) returns observed. In summary, positive 1D returns were seen about 47% of the time.
- However, this percentage decreases to 36% if we consider data for the last 3 years instead of 5.
- Median of the 9 positive returns = 5.4%, and median of the 10 negative returns = -3.1%
Additional data for observed 5-Day (5D) and 21-Day (21D) returns post earnings are summarized along with the statistics in the table below.
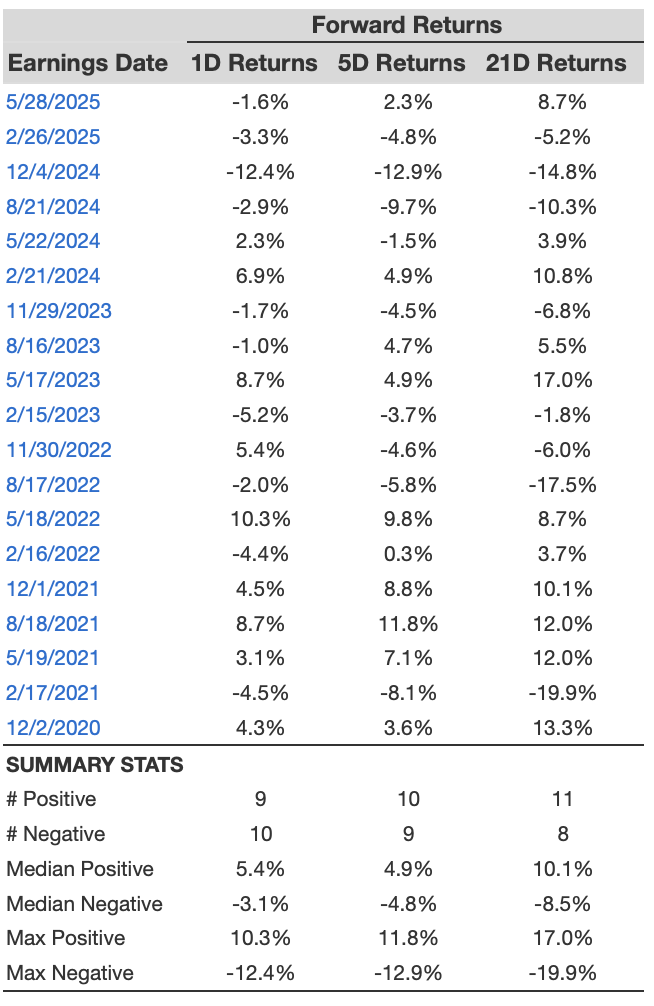
SNPS 1D, 5D, and 21D Post Earnings Return
Correlation Between 1D, 5D, and 21D Historical Returns
A relatively less risky strategy (though not useful if the correlation is low) is to understand the correlation between short-term and medium-term returns post earnings, find a pair that has the highest correlation, and execute the appropriate trade. For example, if 1D and 5D show the highest correlation, a trader can position themselves “long” for the next 5 days if the 1D post-earnings return is positive. Here is some correlation data based on a 5-year and a 3-year (more recent) history. Note that the correlation 1D_5D refers to the correlation between 1D post-earnings returns and subsequent 5D returns.
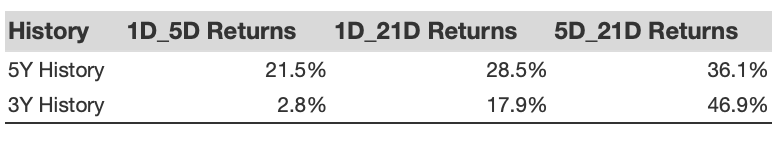
SNPS Correlation Between 1D, 5D and 21D Historical Returns
Is There Any Correlation With Peer Earnings?
Sometimes, peer performance can have an influence on post-earnings stock reaction. In fact, the pricing-in might begin before the earnings are announced. Here is some historical data on the past post-earnings performance of Synopsys stock compared with the stock performance of peers that reported earnings just before Synopsys. For fair comparison, peer stock returns also represent post-earnings one-day (1D) returns.
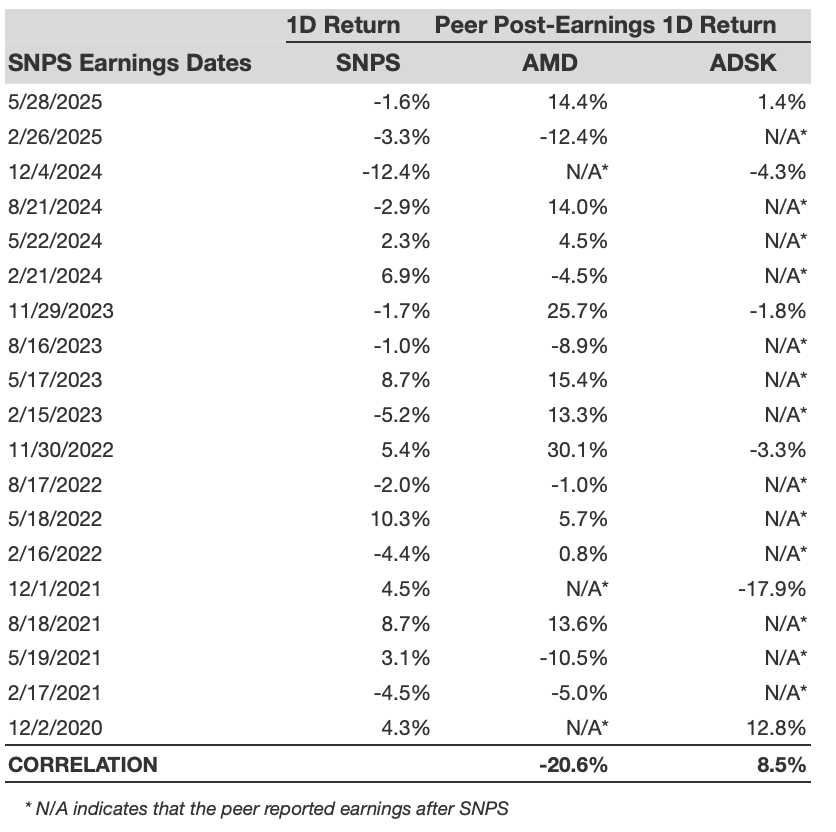
SNPS Correlation With Peer Earnings
Learn more about Trefis RV strategy that has outperformed its all-cap stocks benchmark (combination of all 3, the S&P 500, S&P mid-cap, and Russell 2000), to produce strong returns for investors. Separately, if you want upside with a smoother ride than an individual stock like Synopsys, consider the High Quality portfolio, which has outperformed the S&P and clocked >91% returns since inception.
Invest with Trefis Market-Beating Portfolios
See all Trefis Price Estimates