SLB Prepares to Report Q2 Amid Weak Forecasts and Merger Milestone
SLB’s stock (NYSE: SLB) is set to report its fiscal second-quarter earnings on Friday, July 18, 2025. Analysts predict that the company will report earnings of $0.75 per share on $8.51 billion in sales. This would represent a 4% decline in earnings and a 7% fall in sales compared to the previous year’s figures of $0.78 per share and $9.15 billion, respectively. Historically, the stock has increased following earnings 50% of the time, with a median one-day rise of 2.1% and a maximum growth of 10%.
SLB delivered mixed Q1 2025 results with revenue down 3% to $8.5B and net income falling 25% to $797M. North America revenue rose 8% while international markets declined 5% in Q1. SLB’s $8B all-stock acquisition of ChampionX received final UK regulatory approval on July 15, clearing the last hurdle for the deal to close on Wednesday. The merger, already cleared in the U.S., will integrate ChampionX’s chemicals and automation into SLB’s production systems.
The company has $48 Bil in current market capitalization. Revenue over the last twelve months was $36 Bil, and it was operationally profitable with $6.3 Bil in operating profits and net income of $4.2 Bil. While a lot will depend on how results stack up against consensus and expectations, understanding historical patterns might turn the odds in your favor if you are an event-driven trader.
For event-driven traders, historical patterns may offer an edge, whether by positioning ahead of earnings or reacting to post-release moves. That said, if you seek upside with lower volatility than individual stocks, the Trefis High-Quality portfolio presents an alternative, having outperformed the S&P 500 and generated returns exceeding 91% since its inception. See earnings reaction history of all stocks.

Photo by kristinakasp on Pixabay
SLB’s Historical Odds Of Positive Post-Earnings Return
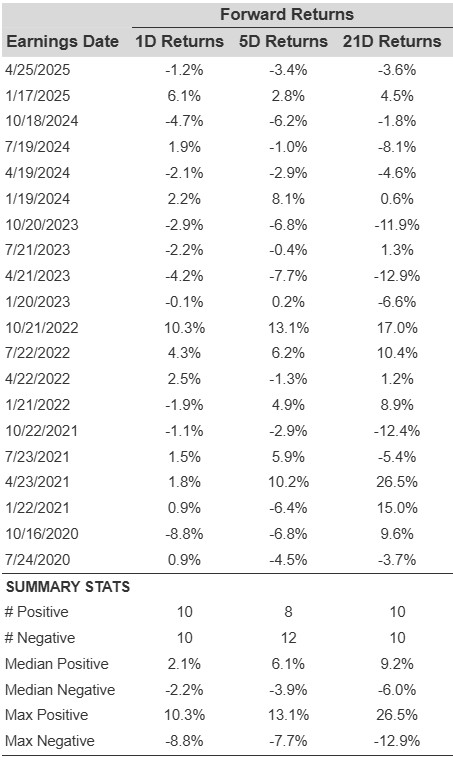
Some observations on one-day (1D) post-earnings returns:
- There are 20 earnings data points recorded over the last five years, with 10 positive and 10 negative one-day (1D) returns observed. In summary, positive 1D returns were seen about 50% of the time.
- However, this percentage decreases to 42% if we consider data for the last 3 years instead of 5.
- Median of the 10 positive returns = 2.1%, and median of the 10 negative returns = -2.2%
Additional data for observed 5-Day (5D), and 21-Day (21D) returns post earnings are summarized along with the statistics in the table below.
Correlation Between 1D, 5D, and 21D Historical Returns
A relatively less risky strategy (though not useful if the correlation is low) is to understand the correlation between short-term and medium-term returns post earnings, find a pair that has the highest correlation, and execute the appropriate trade. For example, if 1D and 5D show the highest correlation, a trader can position themselves “long” for the next 5 days if 1D post-earnings return is positive. Here is some correlation data based on 5-year and 3-year (more recent) history. Note that the correlation 1D_5D refers to the correlation between 1D post-earnings returns and subsequent 5D returns.

Learn more about Trefis RV strategy that has outperformed its all-cap stocks benchmark (combination of all 3, the S&P 500, S&P mid-cap, and Russell 2000), to produce strong returns for investors.
Invest with Trefis Market-Beating Portfolios