How Will CarMax Stock React To Its Upcoming Earnings?

CarMax (NYSE:KMX) is set to report its Q1 FY’26 earnings on Friday, June 20th. Consensus estimates project that revenue will grow to about $7.56 billion for the quarter, up about 6% year-over-year, while adjusted earnings are projected at about $1.19 per share, compared to $0.97 in the year-ago quarter. CarMax has seen its revenues expand, driven by rising second-hand vehicle sales volume and growth in its financing business. Profitability has also been picking up, driven by better cost management as well as digital innovation that has helped to improve customer experience and operational effectiveness. CarMax has $10 billion in current market capitalization. Revenue over the last twelve months was $26 billion, and the company posted a net income of $501 million. That said, if you seek upside with lower volatility than individual stocks, the Trefis High Quality portfolio presents an alternative, having outperformed the S&P 500 and generated returns exceeding 91% since its inception.
See earnings reaction history of all stocks
CarMax’s Historical Odds Of Positive Post-Earnings Return
Some observations on one-day (1D) post-earnings returns:
- How to Get Paid to Buy ORCL at a Steep Discount
- Where Could The Next Breakout for Boeing Stock Come From
- The Hidden Dangers Facing RTX Stock
- Could Freshworks Stock’s Cash Flow Spark the Next Rally?
- Caterpillar Stock On A Winning Streak: Time To Get In Or Book Profits?
- Is Newmont Stock Poised for a Rally?
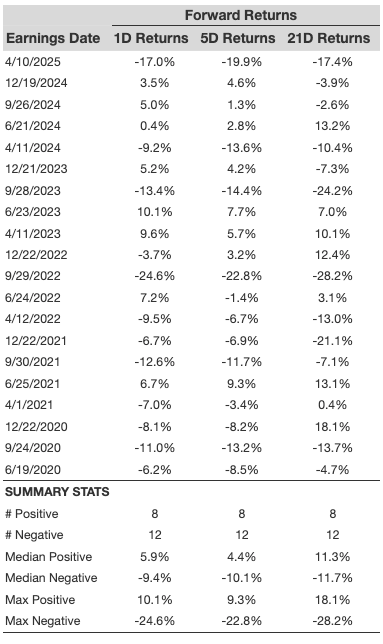
- There are 20 earnings data points recorded over the last five years, with 8 positive and 12 negative one-day (1D) returns observed. In summary, positive 1D returns were seen about 40% of the time.
- Notably, this percentage increases to 58% if we consider data for the last 3 years instead of 5.
- Median of the 8 positive returns = 5.9%, and median of the 12 negative returns = -9.4%
Additional data for observed 5-Day (5D), and 21-Day (21D) returns post earnings are summarized along with the statistics in the table below.
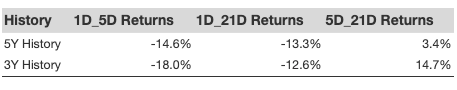
Correlation Between 1D, 5D, and 21D Historical Returns
A relatively less risky strategy (though not useful if the correlation is low) is to understand the correlation between short-term and medium-term returns post earnings, find a pair that has the highest correlation, and execute the appropriate trade. For example, if 1D and 5D show the highest correlation, a trader can position themselves “long” for the next 5 days if 1D post-earnings return is positive. Here is some correlation data based on 5-year and 3-year (more recent) history. Note that the correlation 1D_5D refers to the correlation between 1D post-earnings returns and subsequent 5D returns.
Learn more about Trefis RV strategy that has outperformed its all-cap stocks benchmark (combination of all 3, the S&P 500, S&P mid-cap, and Russell 2000), to produce strong returns for investors. Separately, if you want upside with a smoother ride than an individual stock like CarMax, consider the High Quality portfolio, which has outperformed the S&P, and clocked >91% returns since inception.
Invest with Trefis Market-Beating Portfolios
See all Trefis Price Estimates