A Closer Look At ICE’s Equity Options And Cash Equity Trading Volumes

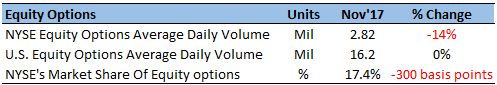
After a slight increase in October, IntercontinentalExchange‘s equity options volumes saw a 14% year on year (y-o-y) decline in November, with a 300 basis point (3%) dip in its market share. The industry-wide equity options daily trading volumes remained around flat in comparison to November 2016. ICE’s market share decline is likely due to competitor NASDAQ’s strong position in equity options after the acquisition of ISE in 2016. Owing to the improvement in U.S. macro conditions, ICE’s trading volumes and market share have improved sequentially from prior months (+7% above October volumes).
ICE’s cash equities volumes suffered the most, with a more than 21% drop in trading volumes and a 110 basis point drop in market share. The industry-wide volumes saw a 17% decline. The company’s continued market share losses over the past few months are a concern.
- Up 24% Since The Start Of 2023, What To Expect From Intercontinental Exchange Stock After Q4 Results?
- Up 7% In The Last One Month, Where Is Intercontinental Exchange Stock Headed?
- Where Is Intercontinental Exchange Stock Headed?
- Intercontinental Exchange Stock Is Trading Below Its Fair Value
- Intercontinental Exchange Stock To Edge Past the Expectations In Q4
- Forecast Of The Day: Intercontinental Exchange Data Services Revenue

The exchange generates around 30% of its revenues from these asset classes. With a soft performance across both, we expect the company’s top line to see some pressure in Q4.
We have a $70 price estimate for Intercontinental Exchange’s stock, which is about in line with the current market price.
See the full Trefis analysis for Intercontinental Exchange
View Interactive Institutional Research (Powered by Trefis):
Global Large Cap | U.S. Mid & Small Cap | European Large & Mid Cap
More Trefis Research