How To Trade FedEx Stock Ahead of Its Upcoming Earnings?

FedEx (NYSE: FDX) will announce its fiscal Q1 2026 earnings on Thursday, September 18, 2025 (fiscal year ends in May). Historically, FDX stock has often reacted negatively to earnings announcements. Over the past five years, the stock dropped on the day after an announcement in 58% of cases. The median decline was 4.0%, with the most significant one-day loss being 21.4%.
For event-driven traders, understanding these historical patterns can be beneficial. You can leverage this information in two ways:
- Pre-earnings positioning: Analyze the historical odds and take a position before the earnings release.
- Post-earnings positioning: Examine the correlation between immediate and medium-term returns after the earnings are released, and then adjust your position accordingly.
Analysts project FedEx to report earnings of $3.64 per share on sales of $21.7 billion for Q1, 2026. This compares to the year-ago quarter’s earnings of $3.60 per share on sales of $21.6 billion.
Looking at fundamentals, FedEx currently has a market capitalization of $55 billion. Over the last twelve months, the company generated $88 billion in revenue, with operating profits of $6.0 billion and a net income of $4.1 billion, indicating operational profitability.
That being said, if you seek an upside with less volatility than holding an individual stock, consider the High Quality Portfolio. It has comfortably outperformed its benchmark—a combination of the S&P 500, Russell, and S&P MidCap indexes—and has achieved returns exceeding 91% since its inception.
See the earnings reaction history of all stocks

Image by John R Perry from Pixabay
FedEx’s Historical Odds Of Positive Post-Earnings Return
Some observations on one-day (1D) post-earnings returns:
- There are 19 earnings data points recorded over the last five years, with 8 positive and 11 negative one-day (1D) returns observed. In summary, positive 1D returns were seen about 42% of the time.
- Notably, this percentage increases to 45% if we consider data for the last 3 years instead of 5.
- Median of the 8 positive returns = 6.6%, and median of the 11 negative returns = -4.0%
Additional data for observed 5-Day (5D) and 21-Day (21D) returns post earnings are summarized along with the statistics in the table below.
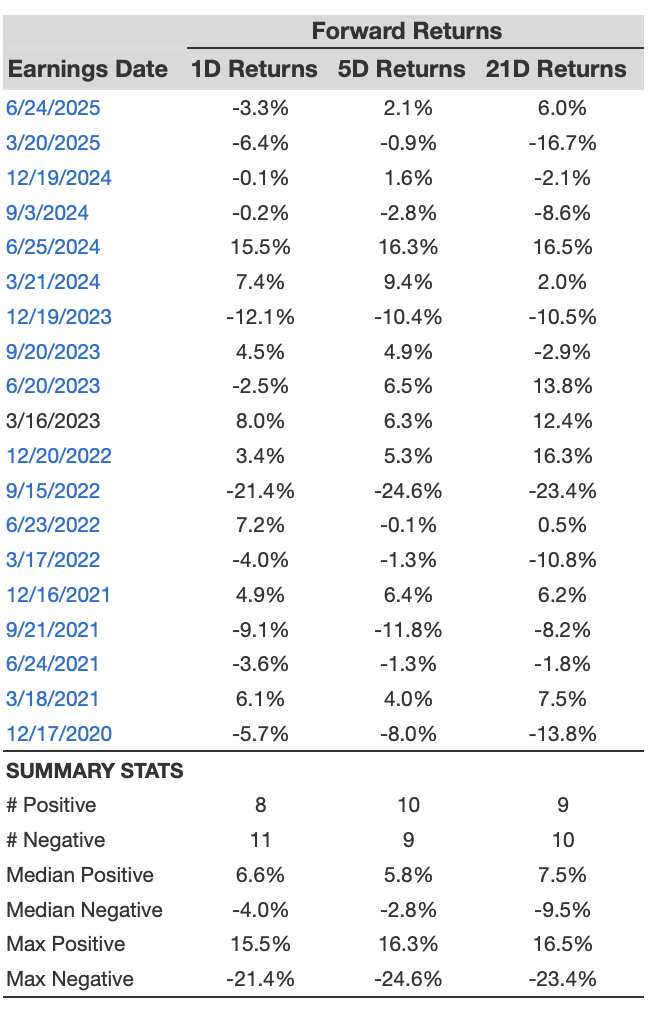
FDX 1D, 5D, and 21D Historical Returns
Correlation Between 1D, 5D, and 21D Historical Returns
A relatively less risky strategy (though not useful if the correlation is low) is to understand the correlation between short-term and medium-term returns post earnings, find a pair that has the highest correlation, and execute the appropriate trade. For example, if 1D and 5D show the highest correlation, a trader can position themselves “long” for the next 5 days if the 1D post-earnings return is positive. Here is some correlation data based on a 5-year and a 3-year (more recent) history. Note that the correlation 1D_5D refers to the correlation between 1D post-earnings returns and subsequent 5D returns.
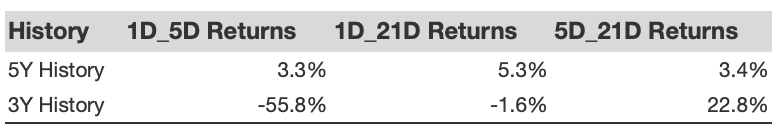
FDX Correlation Between 1D, 5D and 21D Historical Returns
Learn more about Trefis RV strategy that has outperformed its all-cap stocks benchmark (combination of all 3, the S&P 500, S&P mid-cap, and Russell 2000), to produce strong returns for investors. Separately, if you want upside with a smoother ride than an individual stock like FedEx, consider the High Quality portfolio, which has outperformed the S&P and clocked >91% returns since inception.
Invest with Trefis Market-Beating Portfolios
See all Trefis Price Estimates