How Will Elevance Health Stock React To Its Upcoming Earnings?

Elevance Health (NYSE:ELV) is scheduled to announce its earnings on Thursday, July 17, 2025. For event-driven traders, examining historical stock performance around earnings releases can provide valuable insights and potentially enhance trading strategies.
Over the past five years, ELV has demonstrated positive one-day stock returns in 55% of instances following earnings reports. The median positive return on these days was 2.7%, with a maximum one-day positive return reaching 7.7%. Separately, cryptocurrencies have started to move again. See Will The Rally In XRP Price Continue?
Traders can approach earnings announcements with two main strategies:
- Pre-Earnings Positioning: Based on the historical probabilities, one might consider establishing a position before the earnings report is released.
- Post-Earnings Positioning: Alternatively, traders can wait for the earnings announcement and then analyze the relationship between immediate and medium-term returns to guide their subsequent trading decisions.
Analysts’ consensus estimates for Elevance Health’s upcoming report are earnings of $9.19 per share on revenue of $48.26 billion. This is in contrast to the year-ago quarter, where the company reported earnings of $10.12 per share on revenue of $43.22 billion.
- How to Get Paid to Buy ORCL at a Steep Discount
- Where Could The Next Breakout for Boeing Stock Come From
- The Hidden Dangers Facing RTX Stock
- Could Freshworks Stock’s Cash Flow Spark the Next Rally?
- Caterpillar Stock On A Winning Streak: Time To Get In Or Book Profits?
- Is Newmont Stock Poised for a Rally?
From a fundamental standpoint, Elevance Health currently holds a market capitalization of $77 billion. Over the last twelve months, the company generated $183 billion in revenue and reported a net income of $5.9 billion.
That said, if you seek upside with lower volatility than individual stocks, the Trefis High Quality portfolio presents an alternative — having outperformed the S&P 500 and generated returns exceeding 91% since its inception. Also, see the potential for growth in Google Stock To $350?
See earnings reaction history of all stocks

Image by u_vy7ylmip0y from Pixabay
Elevance Health’s Historical Odds Of Positive Post-Earnings Return
Some observations on one-day (1D) post-earnings returns:
- There are 18 earnings data points recorded over the last five years, with 11 positive and 7 negative one-day (1D) returns observed. In summary, positive 1D returns were seen about 61% of the time.
- Notably, this percentage increases to 73% if we consider data for the last 3 years instead of 5.
- Median of the 11 positive returns = 2.7%, and median of the 7 negative returns = -5.3%
Additional data for observed 5-Day (5D), and 21-Day (21D) returns post earnings are summarized along with the statistics in the table below.
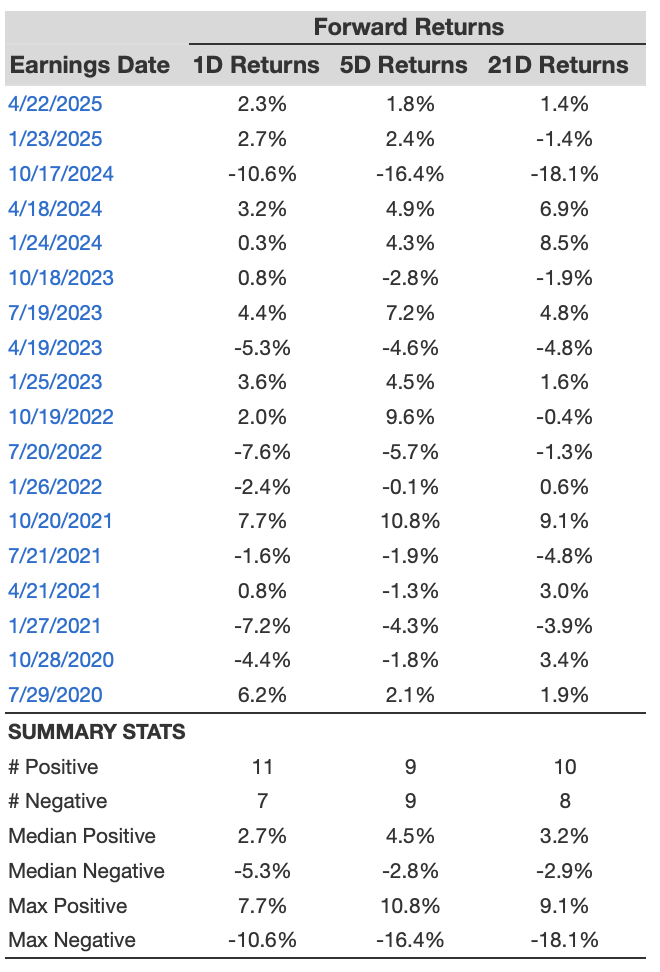
ELV 1D, 5D, and 21D Post Earnings Returns
Correlation Between 1D, 5D, and 21D Historical Returns
A relatively less risky strategy (though not useful if the correlation is low) is to understand the correlation between short-term and medium-term returns post earnings, find a pair that has the highest correlation, and execute the appropriate trade. For example, if 1D and 5D show the highest correlation, a trader can position themselves “long” for the next 5 days if 1D post-earnings return is positive. Here is some correlation data based on 5-year and 3-year (more recent) history. Note that the correlation 1D_5D refers to the correlation between 1D post-earnings returns and subsequent 5D returns.
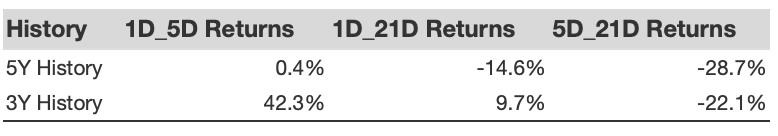
ELV Correlation Between 1D, 5D and 21D Historical Returns
Learn more about Trefis RV strategy that has outperformed its all-cap stocks benchmark (combination of all 3, the S&P 500, S&P mid-cap, and Russell 2000), to produce strong returns for investors. Separately, if you want upside with a smoother ride than an individual stock like Elevance Health, consider the High Quality portfolio, which has outperformed the S&P, and clocked >91% returns since inception.
Invest with Trefis Market-Beating Portfolios
See all Trefis Price Estimates