
How Is DSW Inc. Likely To Grow In The Next Two Years?
DSW Designer Shoe Warehouse (NYSE: DSW) has displayed decent growth in revenue in the last few quarters. In fiscal 2017, net sales for the company rose 3.3% to $2.79 billion. This increase in total net sales was driven by non-comparable store sales and an additional week of sales included in fiscal 2017. The company operates through the DSW and Others (Affiliated Business Group) segments where DSW net sales increased 3.8%, and net sales of Others (Affiliated business group segment) decreased by 2.4% primarily driven by the additional write-downs of Ebuys inventory as a result of their decision to exit from the non-core business in fiscal 2017.
Going forward, we are projecting revenues for its segments to grow following historical trends. Overall, we anticipate the company’s revenue to grow at a compounded annual growth rate (CAGR) of 2%. We have built an explanatory dashboard to outline major drivers of revenue over the next two years.
Estimating DSW Inc. Revenue Growth
DSW Inc. generates revenue from two segments: DSW Revenue Segment and Other Segment (Incl. ABG and Ebuy).
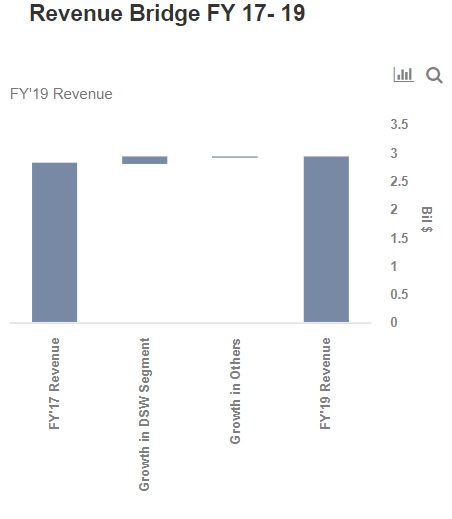
As per our analysis, we believe that the DSW segment of the company is expected to continue to drive strong growth, in line with the guidance provided by the company. Its comparable sales are expected to increase in the single digit range and the opening of 3 to 6 net new locations and development of a new store design and the innovation of new services and technology will drive this growth in the next two years. With customers increasingly engaging with DSW Inc. through multiple ways, the company is more than ever focused on providing a seamless experience across stores and online. All these factors, coupled with strong sales momentum, will enable DSW Inc. to continue to grow its top line.
Our detailed estimates have been highlighted in our dashboard above. You can make changes to our assumed figures to arrive at your own revenue and growth estimates for the company.
What’s behind Trefis? See How It’s Powering New Collaboration and What-Ifs
For CFOs and Finance Teams | Product, R&D, and Marketing Teams
Like our charts? Explore example interactive dashboards and create your own.