
Should You Buy Carnival Stock For Its Cash?
For questions about this article or underlying research, email help@trefis.com.
At its October 22, 2026 close of $27.08, Carnival Corporation (CCL) stock offers a free cash flow yield of 8.6%, against 4.3% for the median S&P 500 company. A yield that high means either a business on sale or one the market expects to shrink. Carnival also owes a lot, and its lenders get paid before its owners. So how much of that cash is really yours as a shareholder?
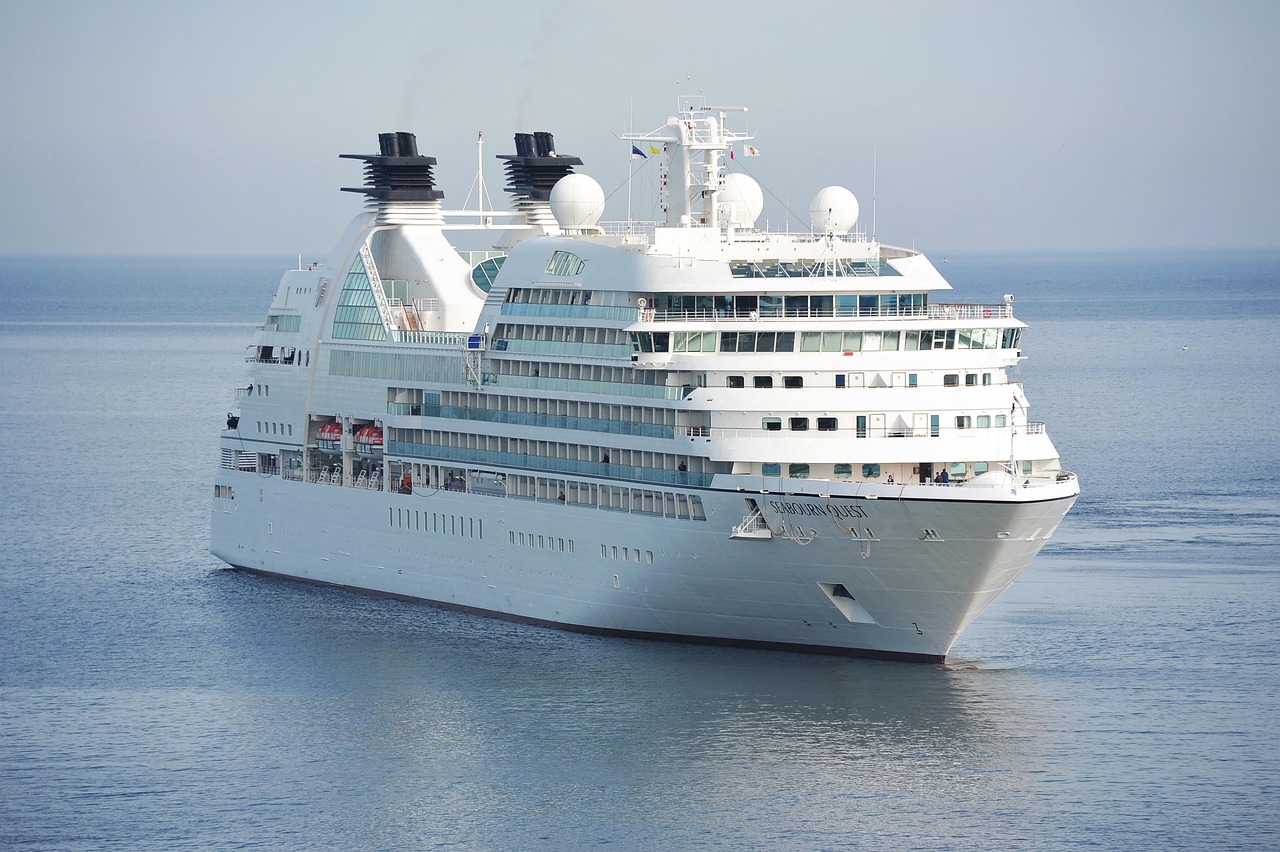
How Much Of Carnival’s Cash Is Yours?
All of it, in proportion to your shares, though lenders are paid before you. A shareholder owns part of the free cash flow Carnival produces, which is the cash left after paying for its operations and its ships, whether or not it is paid out. If investors come to give that cash more credit, the share price could rise to reflect it.
The lenders’ claim at Carnival is large. Net debt, defined as total debt minus cash, equals 64.9% of its market value. Measured against market value plus that debt, the free cash flow yield is 5.2% rather than 8.6%.
How Carnival Turns Cruises Into Cash
Carnival sells cruises mostly in North America and Europe, its two largest segments, and collects customer deposits on trips booked ahead. Management said on the September 29, 2026 call that those deposits reached a third quarter record of about $7.6 billion.
Carnival’s sales are still growing. Revenue over the twelve months to August 31, 2026 was $27.6 billion, up 5.2% from a year earlier. The operating margin was 16.0% over those months, compared with 16.4% a year earlier and 13.9% two years earlier.
Carnival’s operations brought in $6.82 billion of cash over those months, and the company spent 53.4% of that on ships and other capital spending. Free cash flow, the cash left over, came to $3.18 billion. That figure is up from $2.91 billion a year earlier and $1.23 billion in the twelve months to August 2024.
That cash also serves total debt of $25.2 billion at the end of August 2026, and operating income covered interest expense 3.8 times over the past twelve months. So far, rising sales, a steady margin and growing cash look more like a business on sale than one headed for decline.
Why Do Investors Pay So Little For Carnival’s Cash?
Investors may be holding back because of Carnival’s total debt, which equals 68.2% of its market value, against 19.7% for the S&P 500. Fuel is a second worry. Management said higher fuel prices took $0.11 a share off its full-year earnings guidance between June and September.
Capital spending other than on new ships is also set to rise. Management expects non-newbuild capital spending to run somewhat above the $2.4 billion of 2026 for the next few years. Separately, it expects the first quarter of fiscal 2027 to show residual effects of booking disruptions earlier in 2026, which it said weighed on second-half 2026 results.
Management is paying the debt down. On the September 29 call, it said total debt was now below $24 billion, compared with a peak of $36 billion in 2023, and that S&P upgraded Carnival to investment grade during the quarter.
The open questions are whether Carnival’s free cash flow keeps growing as its non-newbuild capital spending rises, and whether its debt keeps falling. Carnival is expected to report its fiscal fourth quarter in December 2026. Its twelve-month free cash flow and its total debt in that report are the two figures to watch.
How To Act On CCL?
Not necessarily on Carnival Corporation alone, if your goal is long-term wealth. Wealth is built by owning the companies that keep outperforming, the leaders of their industries, wherever they are. Here are two companies from Carnival Corporation’s broader travel and leisure sector that have beaten it. Over the five years to October 2026, Hilton Worldwide stock rose 156% and Expedia stock rose 87%, while Carnival Corporation stock rose 23%.
Finding companies like these takes comparison across industries and sectors, and that is what the Trefis High Quality (HQ) Portfolio does. It holds 30 quality companies in equal weight and, since its inception in September 2020, has returned more than 105%, ahead of a benchmark that combines the S&P 500, S&P Mid-cap and Russell 2000. See how we find the leaders.
Spot an error or want more like this? Tell us in 10 seconds.