Is Bed Bath & Beyond Out of The Woods Now?

Despite almost a 36% decline in Bed Bath & Beyond’s stock (NASDAQ: BBBY) since the beginning of this year, at the current price of around $11 per share, we believe Bed Bath & Beyond still has a significant downside. After a disappointing Q1 ending May, the consumer goods retailer saw positive comparable-store trends and also reported a positive cash flow in the month of June. This dramatic improvement was largely due to the reopening of many of its stores in late May. However, the company is definitely not out of the woods yet, but has just been thrown a lifeline.
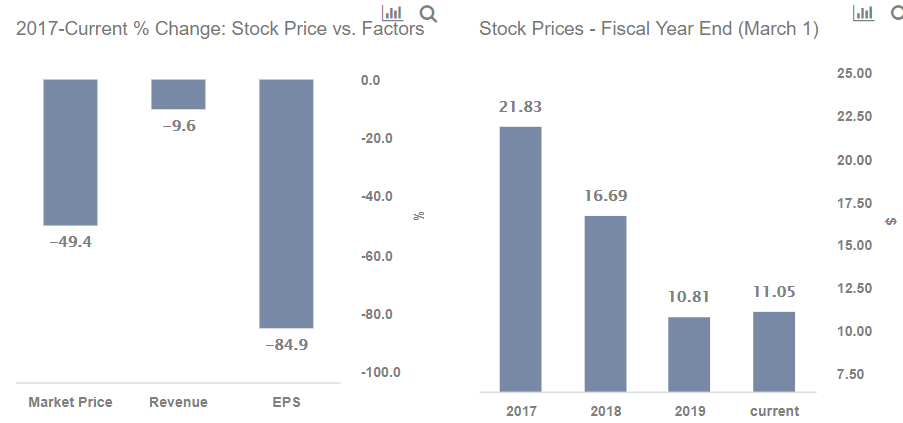
BBBY stock has largely underperformed the broader markets between fiscal 2017 and now. The retailer’s stock is around 49% lower than it was at the end of fiscal 2017 (year ending March 3, 2018), a little over 2 years ago, compared to 22% growth in the S&P. Our dashboard, What Factors Drove 49% Decline in BBBY’s Stock Between Fiscal 2017 and Now? provides the key numbers behind our thinking, and we explain more below.
Some of this decline over the last 2 years is justified by the roughly 10% drop in BBBY’s revenues from $12.3 billion in fiscal 2017 to $11.2 billion in fiscal 2019. This was largely driven by a continued decline in its physical store sales. It should be noted that the company is predominantly a brick and mortar retailer, with roughly under a 20% contribution from digital sales. In addition, adjusted earnings growth, on a per-share basis (EPS), was lower by 85%. This was driven by 290 bps adjusted net margins contraction from 3.4% to 0.5% during this period.
- What To Expect From Bed Bath & Beyond’s Stock Post Q1 Results?
- Down 54% in Six Months, What’s Next For Bed Bath & Beyond Stock?
- Bed Bath & Beyond Up 53% In A Month, What’s Next?
- Overstock.com’s Stock Rose 36% In The Last Month, Will The Rise Continue?
- Can Bath & Body Works Stock Rebound After A 23% Fall In a Month?
- Can BBBY’s Stock Trade Higher Post Q3 Results?
BBBY’s P/E was around 7x to 8x in the last few years. It appeared higher in 2019 as the reported drop in EPS led the P/E ratio to appear higher at that point. The company’s P/E ratio grew from about 7x at the end of FY 2017 to 23x at the end of FY 2019. While the company’s P/E is about 24x now, it could grow further due to a steep decline in profitability going forward.
So how has Coronavirus impacted the stock?
Bed Bath & Beyond has struggled with margin pressure and declining store traffic amid competition from e-commerce and omnichannel competitors in recent years. In fact, it was just initiating a turnaround plan when the pandemic hit. In Q1, the home-goods retailer’s sales plunged by nearly half to $1.3 billion, with temporary store closures being the primary reason for the fall. Even an 82% rise in sales from the company’s digital channels wasn’t enough to ease the damage (albeit increased from a low year-ago number). Its adjusted earnings per share fell from $0.12 a year ago to a loss of $1.96. Meanwhile, gross margin dropped by from 34.5% to 26.7%, a 780 bps contraction – reflecting a huge jump in shipping costs, as well as a shift toward lower-margin items and greater promotional activity.
In the wake of rising costs and expanding net losses, the company plans to cut its annual costs between $250 million and $300 million. The company will also close about 200 of its 955 Bed Bath & Beyond stores in the U.S. and Canada in the next two years.
As BBBY’s sales shift towards digital business, the company will continue to see margin pressures. To add to this, an increase in Covid-19 cases in the U.S. will only lead to lower store traffic. Cost cuts and improvement in product assortments and pricing can only partially offset the company’s current headwinds. Consequently, the company will likely struggle to return to profitability in the near-term.
While Bed Bath & Beyond’s stock may not have much near term upside, another big-box retailer Walmart’s (NYSE:WMT) stock could grow further. We discuss this more in our interactive dashboard – What Factors Drove 30% Change in Walmart’s Stock Between Fiscal 2018 and Now?
In addition, our dashboard forecasting US Covid-19 cases with cross-country comparisons analyzes expected recovery time-frames and possible spread of the virus.
Further, our dashboard -28% Coronavirus crash vs. 4 Historic crashes builds a complete macro picture. Additionally, the complete set of coronavirus impact and timing analyses is available here.
Want out-performance? Try guessing the % returns for our Pershing-inspired portfolio – based on billionaire Bill Ackman’s firm Pershing Square – vs. the S&P over the last 1 week, 1 month, 3 months, YTD or even 3 years. Our portfolio combines high growth, quality, and risk mitigation criteria in an interesting way.
See all Trefis Price Estimates and Download Trefis Data here
What’s behind Trefis? See How It’s Powering New Collaboration and What-Ifs For CFOs and Finance Teams | Product, R&D, and Marketing Teams