How Will Applied Materials Stock React To Its Upcoming Earnings?

Applied Materials (NASDAQ:AMAT) is set to report its Q2 FY’25 earnings in the next few weeks. Revenues are likely to grow by about 7% year-over-year to $7.12 billion, per consensus estimates, while earnings are projected at about $2.31 per share, up from about $2.09 in the year-ago period. There are a couple of trends that will drive earnings. Applied Materials should continue to see a higher mix of advanced equipment, driven by applications such as generative AI and the shift to more advanced process technologies. The AI boom is driving up semiconductor demand, given the need for more computational power, higher memory capacity, and more complex chips. That said, the company warned in February that U.S. government restrictions on the sale of leading-edge chipmaking equipment to Chinese companies could moderate growth somewhat over the quarter.
The company has $122 billion in current market capitalization. Revenue over the last twelve months was $27.2 billion, while net profits came in at $7.2 billion. That said, if you seek upside with lower volatility than individual stocks, the Trefis High Quality portfolio presents an alternative, having outperformed the S&P 500 and generated returns exceeding 91% since its inception.
See earnings reaction history of all stocks
Applied Materials’ Historical Odds Of Positive Post-Earnings Return
- The Real Risk In Your Applied Materials Stock
- After A Large Run, Is Applied Materials Stock A Bet On AI’s Future or Yesterday’s News?
- Everyone Is Watching Applied Materials Stock’s AI Boom. The Real Story Is In The Supply Chain.
- S&P 500 Stocks Trading At 52-Week High
- Where Applied Materials Stock Is Most Exposed
- What Applied Materials Stock Was Shouting Before The Surge
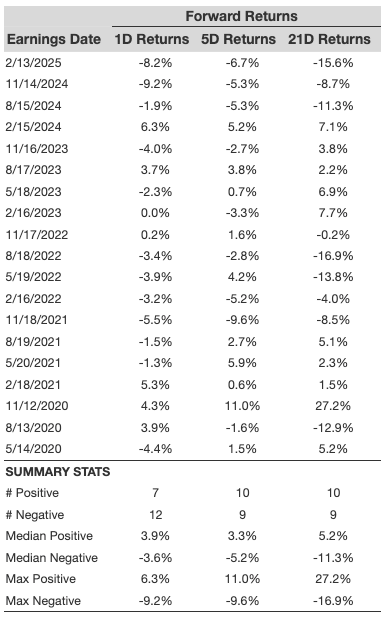
Some observations on one-day (1D) post-earnings returns:
- There are 19 earnings data points recorded over the last five years, with 7 positive and 12 negative one-day (1D) returns observed. In summary, positive 1D returns were seen about 37% of the time.
- However, this percentage decreases to 36% if we consider data for the last 3 years instead of 5.
- Median of the 7 positive returns = 3.9%, and median of the 12 negative returns = -3.6%
Additional data for observed 5-Day (5D) and 21-Day (21D) returns post earnings are summarized along with the statistics in the table below.
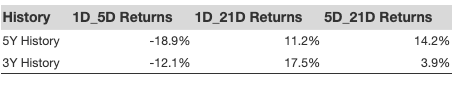
Correlation Between 1D, 5D, and 21D Historical Returns
A relatively less risky strategy (though not useful if the correlation is low) is to understand the correlation between short-term and medium-term returns post earnings, find a pair that has the highest correlation, and execute the appropriate trade. For example, if 1D and 5D show the highest correlation, a trader can position themselves “long” for the next 5 days if 1D post-earnings return is positive. Here is some correlation data based on 5-year and 3-year (more recent) history. Note that the correlation 1D_5D refers to the correlation between 1D post-earnings returns and subsequent 5D returns.
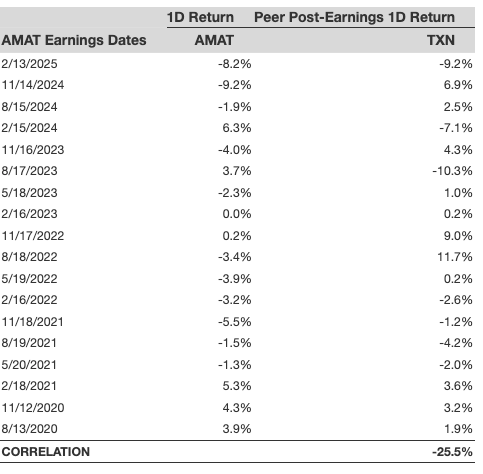
Is There Any Correlation With Peer Earnings?
Sometimes, peer performance can have influence on post-earnings stock reaction. In fact, the pricing-in might begin before the earnings are announced. Here is some historical data on the past post-earnings performance of Applied Materials stock compared with the stock performance of peers that reported earnings just before Applied Materials. For fair comparison, peer stock returns also represent post-earnings one-day (1D) returns.
Learn more about Trefis RV strategy that has outperformed its all-cap stocks benchmark (combination of all 3, the S&P 500, S&P mid-cap, and Russell 2000), to produce strong returns for investors. Separately, if you want upside with a smoother ride than an individual stock like Applied Materials, consider the High Quality portfolio, which has outperformed the S&P, and clocked >91% returns since inception.
Invest with Trefis Market-Beating Portfolios
See all Trefis Price Estimates