This Healthcare Company Is A Better Pick Over Abbott Stock

We think that Thermo Fisher Scientific stock (NYSE: TMO) currently is a better pick compared to Abbott Labs stock (NYSE: ABT), with a similar market capitalization in the healthcare sector, despite its comparatively expensive valuation. ABT stock trades at 4.9x trailing revenues, compared to 5.6x for Thermo Fisher Scientific. Both the companies saw a rise in revenue over the last year, with Covid-19 testing driving their sales. Thermo Fisher Scientific manufactures analytical laboratory instruments used in various tests, and the pandemic has led to a surge in demand for these instruments.
Looking at stock returns over the last six months, both the companies have seen a fall along with the broader markets, and TMO has fared slightly better than ABT. While TMO stock has been down 2% over the last six months, ABT has seen a fall of 7%. This compares with a 3% fall for the broader S&P500 index. However, there is more to the comparison. Let’s step back to look at the fuller picture of the relative valuation of the two companies by looking at historical revenue growth and operating margin growth. Our dashboard Abbott vs. Thermo Fisher Scientific: Similar Market Cap; Which Stock Is A Better Bet? has more details. Parts of the analysis are summarized below.
1. Thermo Fisher Scientific Revenue Growth Has Been Stronger
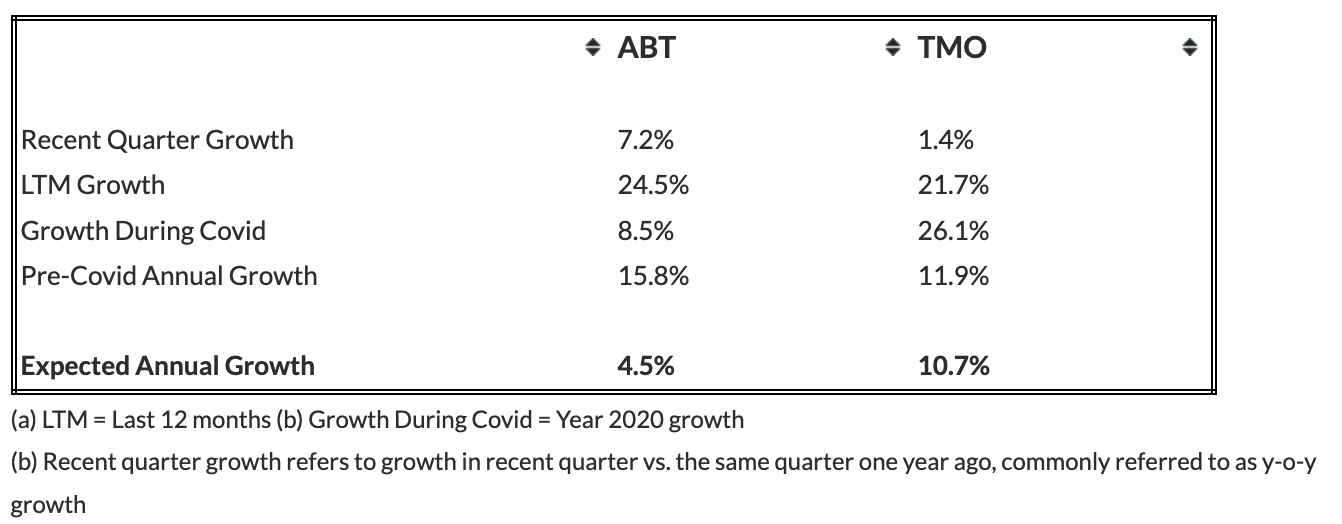
- Both companies managed to see sales growth over the last twelve months. Still, Abbott has witnessed comparatively faster revenue growth of 24.5% vs. 21.7% for Thermo Fisher Scientific.
- Looking at a longer time frame, Abbott’s sales grew at a CAGR of 12.4% to $43.1 billion over the last twelve months, compared to $30.6 billion in 2018, while Thermo Fisher Scientific’s revenues have risen at a CAGR of 17.4% to $39.2 billion from $24.4 billion over the same period.
- The companies’ revenue growth has been driven by a very high demand for Covid-19 testing over the recent past. However, as the Covid-19 cases decline, the demand for testing is also expected to fall, weighing on Abbott’s diagnostics business in 2022. Thermo Fisher Scientific’s sales growth is buoyed by continued market share gains for its instruments. Note that once the devices are installed, it also generates recurring revenue in the form of after-sales service, and it also results in demand for consumables.
- Our Abbott Revenue and Thermo Fisher Scientific Revenue dashboard provides more insight into the company’s revenues compared to that of its peers.
- Looking forward, Thermo Fisher Scientific’s revenue is expected to grow faster compared to Abbott’s. The table below summarizes our revenue expectation for both the companies over the next three years and points to a CAGR of 4.5% for Abbott, compared to a CAGR of 10.7% for Thermo Fisher Scientific.
- Note that we have different methodologies for companies negatively impacted by Covid and for companies not impacted or positively impacted by Covid while forecasting future revenues. For companies negatively affected by Covid, we consider the quarterly revenue recovery trajectory to forecast recovery to pre-Covid revenue run rate. Beyond the recovery point, we apply the average annual growth observed in the three years before Covid to simulate return to normal conditions. For companies registering positive revenue growth during Covid, we consider yearly average growth before Covid with a certain weight to growth during Covid and the last twelve months.
- Should You Pick Abbott Stock At $105 After A Solid Q2?
- Down 7% This Year Will Abbott Stock See Higher Levels Post Q2 Results?
- How Does The Current Fall In Abbott Stock Compare With The One During 2008 Recession?
- Should You Pick Abbott Stock At $105 After An Upbeat Q1?
- After Nearly A 20% Rise In Six Months Will Abbott Stock See Higher Levels Post Q1?
- What’s Next For Abbott Stock After A 6% Rise This Year?
2. Abbott Has Seen Better Margin Growth, And It Offers Lower Risk
- Looking at profitability, similar to the trend seen in revenue growth, Thermo Fisher Scientific’s operating margin of 27% over the last twelve-month period is better than the 21% figure for Abbott.
- This compares with 16% and 21% operating margin seen in 2019, before the pandemic, respectively.
- Abbott’s free cash flow margin of 24% is in-line with that for Thermo Fisher Scientific.
- Our Abbott Operating Income and Thermo Fisher Scientific Operating Income dashboards provide more details on the companies’ operating income and operating margins.
- Looking at financial risk, Abbott trumps Thermo Fisher Scientific. Its 8% debt as a percentage of equity is much lower than 16% for Thermo Fisher Scientific. Similarly, Abbott’s 14% cash as a percentage of assets is much higher than 5% for the latter, implying that Abbott has better debt and cash position.
3. The Net of It All
- We see that the revenue growth has been better for Thermo Fisher Scientific over recent years and its current operating margins are also better than Abbott’s. Now, Abbott’s margin growth has been better over the recent years, and it is trading at a relatively lower valuation. Furthermore, Abbott offers lower financial risk compared to Thermo Fisher Scientific, suggesting that Abbott may be the better pick among the two.
- However, we don’t think ABT is the better pick over TMO. Looking at prospects, using P/S as a base, due to high fluctuations in P/E and P/EBIT, we believe Thermo Fisher Scientific is currently the better choice of the two.
- The table below summarizes our revenue and return expectation for Abbott and Thermo Fisher Scientific over the next three years and points to an expected return of 9% for ABT stock over this period vs. 26% expected returns for TMO stock, implying that investors are better off buying TMO over ABT, based on our dashboard – Abbott vs. Thermo Fisher Scientific – which also provides more details on how we arrive at these numbers.

While TMO stock may outperform ABT, the Covid-19 crisis has created many pricing discontinuities which can offer attractive trading opportunities. For example, you’ll be surprised how counter-intuitive the stock valuation is for Xylem vs. Merck.
What if you’re looking for a more balanced portfolio instead? Here’s a high-quality portfolio that’s beaten the market consistently since the end of 2016.
| Returns | Mar 2022 MTD [1] |
2022 YTD [1] |
2017-22 Total [2] |
| ABT Return | 0% | -14% | 213% |
| TMO Return | 2% | -17% | 294% |
| S&P 500 Return | 2% | -6% | 100% |
| Trefis MS Portfolio Return | 1% | -9% | 257% |
[1] Month-to-date and year-to-date as of 3/3/2022
[2] Cumulative total returns since the end of 2016