What’s Fueling Abbott’s Stock Price Growth?

Abbott Labs’ (NYSE:ABT) share price has more than doubled over the last three years. This can be attributed to steady growth in its revenues, margin expansion, price to earnings multiple growth, and lower share count. Note that Abbott acquired St. Jude Medical and Alere in 2016 and 2017 respectively, which led to sharp jump in the revenues. In this note we discuss these factors that contributed to Abbott’s stock price growth. Look at our interactive dashboard analysis ~ Why Did Abbott Laboratories’ Stock More Than Double Over The Last Three Years? ~ for more details. You can also look at our data for healthcare companies here.
Abbott’s Stock Price More Than Doubled From Around $40 By The End of Q2 2016 To $84 By The End of Q2 2019, Led By Growth In Revenue, Margins, P/E Multiple Expansion, And A Decline In No. of Shares.

- Abbott Labs is a diversified healthcare conglomerate with a global presence. The firm operates in four main segments: Nutritionals, Diagnostics, Medical Devices, and Established Pharmaceutical Products.
- The Medical Devices segment includes minimally invasive medical devices for heart diseases, strokes, carotid artery diseases, and other serious vascular conditions.
- The Diagnostics segment includes systems and tests used for screening for drugs of abuse, cancer, therapeutic drug monitoring, fertility, physiological diseases, and infectious diseases such as hepatitis and HIV.
- The Nutritional segment includes pediatric, adult, healthy living and sports nutrition products, such as infant formulas, snack bars, and meal replacement shakes.
- The Established Pharmaceutical Products segment includes a broad line of generic drugs that are manufactured worldwide and sold outside the U.S.
- Should You Pick Abbott Stock At $105 After An Upbeat Q1?
- After Nearly A 20% Rise In Six Months Will Abbott Stock See Higher Levels Post Q1?
- What’s Next For Abbott Stock After A 6% Rise This Year?
- Is Abbott Stock Undervalued At $95?
- Which Is A Better Pick – Abbott Stock Or Amgen?
- Is Abbott Stock A Better Healthcare Pick Over Thermo Fisher Scientific?
#1. Revenues Could Grow 53% From $20.85 Billion In 2016 to $31.96 Billion In 2019. The Biggest Change In Revenue Is Driven By The Company’s Medical Devices Segment, Led By St Jude Acquisition In 2016.

- Abbott’s Medical Devices revenues jumped sharply in 2017, due to the acquisition of St. Jude Medical. The figure stood at $11.4 billion in 2018, and it is estimated to be $12.2 billion in 2019, primarily led by primarily led by increased adoption of its HeartMate device, as well as higher sales of electrophysiology, structural heart, and diabetes devices.
- Abbott’s Diagnostics Revenue has increased from $4.6 billion in 2016 to $7.5 billion in 2018,, due to Alere acquisition. Looking forward, we expect the division’s revenue to increase driven by increasing demand for diagnosis and point-of-care test equipment.
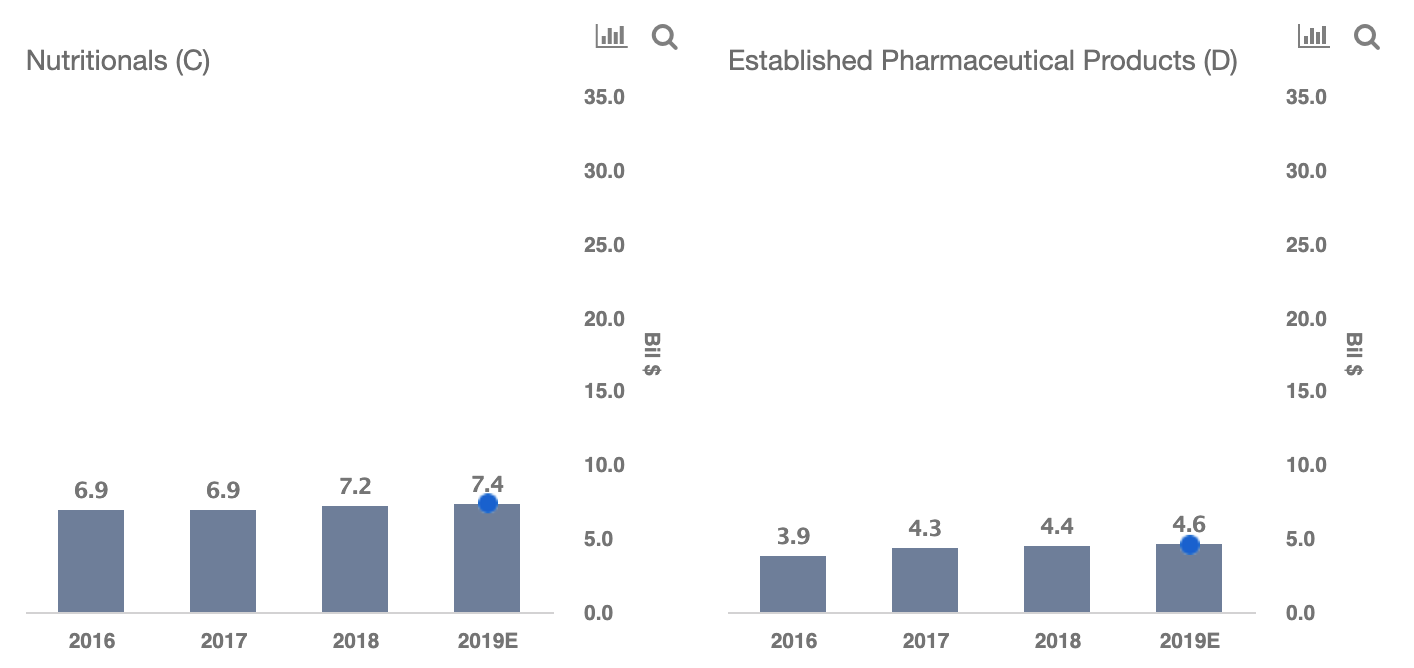
- Abbott’s Nutritionals Revenue has remained more or less around the $7 billion mark in the recent years. It will likely be around $7.4 billion in 2019, led by its established brands, as well as some of the new launches.
- Established Pharmaceutical Products revenue grew from $3.9 billion in 2016 to $4.4 billion in 2018, and it could grow to $4.6 billion in 2019, led by continued expansion in key emerging markets.
#2. Net Income Grew At A Higher Pace Compared To Abbott’s Revenues, Led By Margin Expansion.

- Abbott’s adjusted net income grew from $3.3 billion in 2016 to $5.1 billion in 2018, and an estimated $5.7 billion in 2019.
- This can be attributed to higher revenues and growth in net income margin.
- Adjusted net income margin grew from 15.7% in 2016 to around 16.8% in 2018, and we forecast it to be 17.9% in 2019.
#2.1 Total Expenses Could Increase From $17.6 Billion In 2016 To $26.2 Billion In 2019. However, Total Costs As A Percentage of Revenue Have Seen A Decline. Our Forecast For 2019 Is Based On Historical Trends.

- While Abbott’s total expenses grew from $17.6 billion in 2016 to $25.4 billion in 2018, and an estimated $26.2 billion in 2019, total expenses as % of revenue declined from 84.3% in 2016 to 83.2% in 2018, and an estimated 82.1% in 2019.
- COGS as % of revenue declined slightly from 43.3% in 2016 to 41.6% in 2018, and it is estimated to be 41.5% in 2019.

- Amortization of intangible assets as % of revenue increased sharply from 2.6% in 2016 to 7.1% in 2018, and it is estimated to be around 7.0% in 2019.
- R&D as % of revenue grew from 6.8% in 2016 to 7.5% in 2018, and it is estimated to be7.4% in 2019.
- SG&A as % of revenue saw a modest decline from 32.0% in 2016 to 31.9% i 2018, and it could decline to 31.8% in 2019.

- Interest & other expenses as % of revenue has fluctuated in the past. It declined from 8.5% in 2016 to 2.5% in 2018, and it is estimated to be 2.4% in 2019.
- Effective tax rate has also fluctuated in the recent years. It grew from 25% in 2016 to 84% in 2017, reflecting the impact of tax bill. It fell to 19% in 2018, and it is estimated to be 28% in 2019.
- Non-GAAP adjustments as % of revenue grew from -10.6% in 2016 to -9.1% in 2018, and it is estimated to be -10.8% in 2019.
#3. Price To Earnings Multiple for Abbott Grew From 18x in 2016 To 26x in 2019 (End of Q2).

What’s behind Trefis? See How it’s Powering New Collaboration and What-Ifs
For CFOs and Finance Teams | Product, R&D, and Marketing Teams
Like our charts? Explore example interactive dashboards and create your own.