How Will Alcoa Stock React To Its Upcoming Earnings?

Alcoa (NYSE:AA) is set to report its earnings on Wednesday, July 16, 2025. Consensus earnings are pegged at about $0.51 per share, while revenues are expected to rise by close to 2% compared to the year ago quarter. The company’s results expectations are shaped by tariff disruptions, mixed performance across business units, and uncertain aluminum demand—offset slightly by resilient alumina margins and internal cost controls. The Alumina segment is expected to remain strong, benefiting from steady demand and favorable cost structures. The Aluminum segment is under pressure from higher costs and global pricing weakness, particularly impacted by the tariff burden.
The company has $7.9 Bil in current market capitalization. Revenue over the last twelve months was $13 Bil, and it was operationally profitable with $1.6 Bil in operating profits and net income of $860 Mil. That said, if you seek upside with lower volatility than individual stocks, the Trefis High Quality portfolio presents an alternative – having outperformed the S&P 500 and generated returns exceeding 91% since its inception.
See earnings reaction history of all stocks
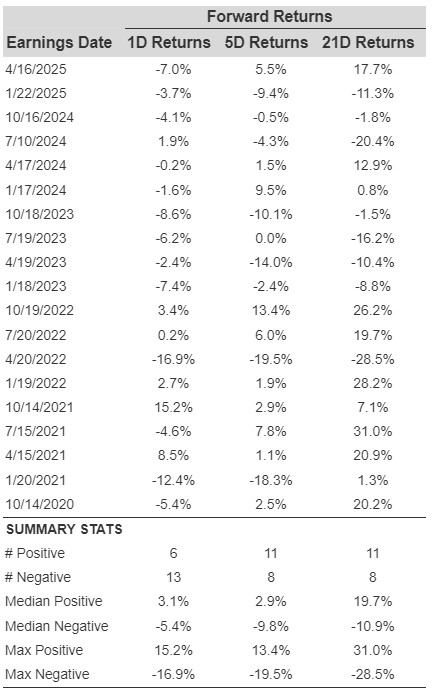
Alcoa’s Historical Odds Of Positive Post-Earnings Return
Some observations on one-day (1D) post-earnings returns:
- There are 19 earnings data points recorded over the last five years, with 6 positive and 13 negative one-day (1D) returns observed. In summary, positive 1D returns were seen about 32% of the time.
- However, this percentage decreases to 25% if we consider data for the last 3 years instead of 5.
- Median of the 6 positive returns = 3.1%, and median of the 13 negative returns = -5.4%
Additional data for observed 5-Day (5D), and 21-Day (21D) returns post earnings are summarized along with the statistics in the table below.
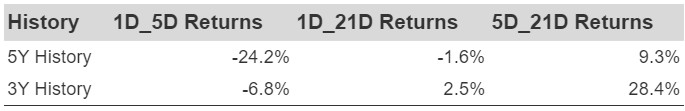
Correlation Between 1D, 5D, and 21D Historical Returns
A relatively less risky strategy (though not useful if the correlation is low) is to understand the correlation between short-term and medium-term returns post earnings, find a pair that has the highest correlation, and execute the appropriate trade. For example, if 1D and 5D show the highest correlation, a trader can position themselves “long” for the next 5 days if 1D post-earnings return is positive. Here is some correlation data based on 5-year and 3-year (more recent) history. Note that the correlation 1D_5D refers to the correlation between 1D post-earnings returns and subsequent 5D returns.
Learn more about Trefis RV strategy that has outperformed its all-cap stocks benchmark (combination of all 3, the S&P 500, S&P mid-cap, and Russell 2000), to produce strong returns for investors. Separately, if you want upside with a smoother ride than an individual stock like Alcoa, consider the High Quality portfolio, which has outperformed the S&P, and clocked >91% returns since inception.
See all Trefis Price Estimates