
Anthropic (ANT)
Market Price (11/20/2026): $90.87 | Market Cap: $1.2 TrilSector: Information Technology | Industry: Application Software
Anthropic (ANT)
Market Price (11/20/2026): $90.87Market Cap: $1.2 TrilSector: Information TechnologyIndustry: Application Software
Investment Highlights Why It Matters Detailed financial logic regarding cash flow yields vs trend-riding momentum.
Megatrend and thematic driversMegatrends include Artificial Intelligence. Themes include AI Software Platforms. | Trading close to highsDist 52W High is 0.0%, Dist 3Y High is 0.0% Weak multi-year price returns2Y Excs Rtn is -25%, 3Y Excs Rtn is -65% | Key risksANT key risks include [1] the immense financial burden from its massive, Show more. |
| Megatrend and thematic driversMegatrends include Artificial Intelligence. Themes include AI Software Platforms. |
| Trading close to highsDist 52W High is 0.0%, Dist 3Y High is 0.0% |
| Weak multi-year price returns2Y Excs Rtn is -25%, 3Y Excs Rtn is -65% |
| Key risksANT key risks include [1] the immense financial burden from its massive, Show more. |
Price Returns Compared
| 2021 | 2022 | 2023 | 2024 | 2025 | 2026 | Total [1] | |
|---|---|---|---|---|---|---|---|
| Returns | |||||||
| ANT Return | - | - | - | - | - | 0% | 0% |
| Peers Return | 32% | -34% | 83% | 40% | 28% | -6% | 167% |
| S&P 500 Return | 27% | -19% | 24% | 23% | 16% | 8% | 97% |
Monthly Win Rates [3] | |||||||
| ANT Win Rate | - | - | - | - | - | 0% | |
| Peers Win Rate | 67% | 32% | 75% | 68% | 50% | 44% | |
| S&P 500 Win Rate | 75% | 42% | 67% | 75% | 67% | 36% | |
Max Drawdowns [4] | |||||||
| ANT Max Drawdown | - | - | - | - | - | - | |
| Peers Max Drawdown | -14% | -44% | -16% | -18% | -27% | -29% | |
| S&P 500 Max Drawdown | -5% | -25% | -10% | -8% | -19% | -9% | |
[1] Cumulative total returns since the beginning of 2021
[2] Peers: GOOGL, MSFT, META, AMZN, IBM.
[3] Win Rate = % of calendar months in which monthly returns were positive
[4] Max drawdown represents maximum peak-to-trough decline within a year
[5] 2026 data is for the year up to 11/19/2026 (YTD)
How Low Can It Go
ANT has limited trading history. Below is the Information Technology sector ETF (XLK) in its place.
| Event | XLK | S&P 500 |
|---|---|---|
| 2025 US Tariff Shock | ||
| % Loss | -25.7% | -18.8% |
| % Gain to Breakeven | 34.5% | 23.1% |
| Time to Breakeven | 65 days | 79 days |
| 2024 Yen Carry Trade Unwind | ||
| % Loss | -17.0% | -7.8% |
| % Gain to Breakeven | 20.4% | 8.5% |
| Time to Breakeven | 92 days | 18 days |
| Summer-Fall 2023 Five Percent Yield Shock | ||
| % Loss | -10.0% | -9.5% |
| % Gain to Breakeven | 11.2% | 10.5% |
| Time to Breakeven | 15 days | 24 days |
| 2022 Inflation Shock & Fed Tightening | ||
| % Loss | -33.1% | -24.5% |
| % Gain to Breakeven | 49.5% | 32.4% |
| Time to Breakeven | 246 days | 427 days |
| 2020 COVID-19 Crash | ||
| % Loss | -31.2% | -33.7% |
| % Gain to Breakeven | 45.2% | 50.9% |
| Time to Breakeven | 78 days | 140 days |
| Q4 2018 Fed Policy Error / Growth Scare | ||
| % Loss | -23.8% | -19.2% |
| % Gain to Breakeven | 31.2% | 23.8% |
| Time to Breakeven | 100 days | 105 days |
In The Past
State Street Technology Select Sector SPDR ETF's stock fell -25.7% during the 2025 US Tariff Shock. Such a loss loss requires a 34.5% gain to breakeven.
Preserve Wealth
Limiting losses and compounding gains is essential to preserving wealth.
Asset Allocation
Actively managed asset allocation strategies protect wealth. Learn more.
ANT has limited trading history. Below is the Information Technology sector ETF (XLK) in its place.
| Event | XLK | S&P 500 |
|---|---|---|
| 2025 US Tariff Shock | ||
| % Loss | -25.7% | -18.8% |
| % Gain to Breakeven | 34.5% | 23.1% |
| Time to Breakeven | 65 days | 79 days |
| 2022 Inflation Shock & Fed Tightening | ||
| % Loss | -33.1% | -24.5% |
| % Gain to Breakeven | 49.5% | 32.4% |
| Time to Breakeven | 246 days | 427 days |
| 2020 COVID-19 Crash | ||
| % Loss | -31.2% | -33.7% |
| % Gain to Breakeven | 45.2% | 50.9% |
| Time to Breakeven | 78 days | 140 days |
| Q4 2018 Fed Policy Error / Growth Scare | ||
| % Loss | -23.8% | -19.2% |
| % Gain to Breakeven | 31.2% | 23.8% |
| Time to Breakeven | 100 days | 105 days |
| 2008-2009 Global Financial Crisis | ||
| % Loss | -51.5% | -53.4% |
| % Gain to Breakeven | 106.2% | 114.4% |
| Time to Breakeven | 797 days | 1085 days |
In The Past
State Street Technology Select Sector SPDR ETF's stock fell -25.7% during the 2025 US Tariff Shock. Such a loss loss requires a 34.5% gain to breakeven.
Preserve Wealth
Limiting losses and compounding gains is essential to preserving wealth.
Asset Allocation
Actively managed asset allocation strategies protect wealth. Learn more.
About Anthropic (ANT)
Anthropic (ANT) is a leading artificial intelligence research laboratory dedicated to developing "super intelligence" for the long-term benefit of humanity, with a strong emphasis on responsible and safe AI development. The company's flagship product is Claude, a frontier intelligence AI model delivered to customers through its models, platform, and applications. Claude has experienced unprecedented enterprise adoption, generating revenue of $17.0 billion for the three months ended September 30, 2026, from a commercial launch in the first quarter of 2023. Anthropic's primary focus is on serving enterprise customers, integrating their feedback to refine Claude's capabilities for a wide range of real-world business applications, from routine knowledge work to complex problem-solving.
The company's competitive advantages are rooted in its integrated approach to frontier capability and safety research, ensuring the development of reliable and steerable AI systems. Anthropic employs a unique "closing the loop" recursive development dynamic, where each version of Claude contributes to building the next, accelerating innovation. Furthermore, the company strategically manages a fungible pool of compute resources across diverse partners, including AWS Trainium, Google TPUs, NVIDIA, and AMD GPUs, dynamically optimizing for price and performance. This efficient compute infrastructure and continuous innovation support Anthropic's mission to deliver advanced AI solutions that can significantly accelerate global growth and improve quality of life.
AI Analysis | Feedback
NVIDIA for AI models
Microsoft Azure for intelligence-as-a-service
AI Analysis | Feedback
- Claude (AI Models): Anthropic's flagship frontier intelligence system, providing advanced AI capabilities for reasoning, analysis, and creation.
- AI Platform: A proprietary infrastructure enabling customers to access and integrate Claude models into their own systems and workflows.
- AI Applications: Software solutions developed by Anthropic that utilize Claude's capabilities to address specific enterprise use cases.
AI Analysis | Feedback
Anthropic (ANT) primarily sells to other companies, focusing on "enterprise adoption" and "enterprise use cases." The provided background information does not list the specific names or symbols of its customer companies. However, it indicates that Claude has experienced rapid adoption across a broad range of enterprises for various use cases, from routine knowledge work to complex problems.
AI Analysis | Feedback
- Amazon.com, Inc. (AMZN)
- Alphabet Inc. (GOOGL)
- NVIDIA Corporation (NVDA)
- Advanced Micro Devices, Inc. (AMD)
AI Analysis | Feedback
AI Analysis | Feedback
Key Business Risks for Anthropic (ANT)
- Massive Compute and Infrastructure Commitments: Anthropic has entered into substantial purchase commitments and lease agreements totaling approximately $900.9 billion for compute and infrastructure, with a significant portion due in the coming years and extending to 2045. This immense capital expenditure represents a significant financial risk if the demand for Claude does not continue its rapid growth, if technological advancements render portions of this committed compute obsolete, or if anticipated cost efficiencies are not realized. A miscalculation in future demand or technology shifts could place a severe financial burden on the company.
- Failure in Responsible AI Development and Safety: A core tenet of Anthropic's mission and a stated "core advantage" is the responsible development and maintenance of advanced AI, along with mitigating significant risks. The company emphasizes its integrated frontier and safety research to produce reliable and steerable systems. A failure to adequately manage and mitigate the inherent risks associated with advanced AI could lead to severe reputational damage, regulatory scrutiny, loss of customer trust, or even adverse real-world consequences, which would fundamentally undermine its business and mission.
- Inability to Maintain Frontier Intelligence and Enterprise Adoption: Anthropic's business model relies on continuously advancing "frontier intelligence" through its research and innovation velocity, leading to rapid enterprise adoption of Claude. The company highlights its "improvement loop" and "investment loop" as self-reinforcing dynamics. Should Anthropic fail to maintain its leadership in AI capabilities against competitors, or if the enterprise market for advanced AI experiences slower-than-anticipated growth or faces significant barriers to adoption, it could impede revenue growth and market penetration.
AI Analysis | Feedback
AI Analysis | Feedback
AI Analysis | Feedback
Here are 3 expected drivers of future revenue growth for Anthropic (ANT) over the next 2-3 years:
- Expanding Enterprise Adoption and Penetration: Anthropic anticipates continued rapid growth by focusing on deploying its frontier intelligence, Claude, across a wider range of enterprise use cases. The company's enterprise strategy aims to maximize economic impact by addressing everything from routine knowledge work to complex problems, leveraging customer feedback to broaden where Claude can be deployed and further expand adoption.
- Continuous Innovation and Release of Advanced AI Models and Capabilities: As a research lab, Anthropic emphasizes sustained, focused frontier and safety research. This commitment leads to the consistent release of more capable models, platform capabilities, and applications. The "improvement loop" and "closing the loop" dynamics described by the company ensure compounding improvements and faster innovation, resulting in increasingly reliable, steerable, and effective systems for demanding enterprise environments.
- Strategic Investment in and Efficient Management of Compute Resources: Anthropic has committed substantial capital to compute and infrastructure, including approximately $451.6 billion expected by December 31, 2030, and $70.7 billion in the next 12 months following September 30, 2026. This investment, combined with their multi-chip compute architecture across various providers, enables the company to advance frontier capabilities, meet growing customer demand, and deliver superior models efficiently, thus supporting scalable growth and innovation.
AI Analysis | Feedback
Share Repurchases
- In October 2025, Anthropic repurchased approximately $627 million worth of Series B redeemable convertible preferred stock from the U.S. government.
Share Issuance
- In November 2026, Anthropic completed its initial public offering (IPO), pricing 980 million Class A common shares at $83.00 per share, raising approximately $81.3 billion.
- Concurrently with the IPO, Anthropic executed a private placement of $26 billion in non-voting Class N shares to seven strategic partners, including Google and Nvidia.
- The total fundraising from the IPO and private placement exceeded $107 billion.
Inbound Investments
- Anthropic secured $26 billion in private investment from seven technology companies (Google, Nvidia, AMD, Broadcom, Micron, Microsoft, and TSMC) as part of its IPO in November 2026.
- Amazon has invested $8 billion in Anthropic by November 2024, with further agreements for up to an additional $20 billion. Amazon's total position, including convertible notes and nonvoting preferred stock, was valued at approximately $61 billion by early 2026.
- Anthropic raised $65 billion in a Series H funding round in May 2026, following a $30 billion Series G round in February 2026, and a $13 billion Series F round in September 2025.
Capital Expenditures
- Anthropic has committed approximately $900.9 billion for compute and infrastructure through purchase commitments and lease agreements, extending through 2045.
- Approximately $70.7 billion of these commitments are due in the 12 months following September 30, 2026.
- The primary focus of these expenditures is to secure computing capacity and infrastructure, including multi-chip architectures from AWS Trainium, Google TPUs, NVIDIA GPUs, and AMD GPUs.
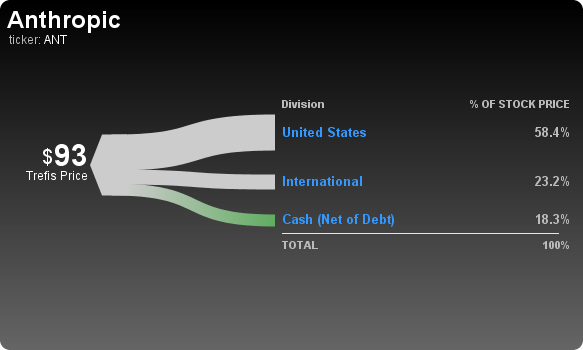
Latest Trefis Analyses
| Title | Date | |
|---|---|---|
| ARTICLES | ||
| Anthropic At $1.3 Trillion: Five Lines | 11/20/2026 | |
| Will Anthropic Stay On Top? Half Of Tech Leaders Didn’t | 11/20/2026 | |
| Should Anthropic Thank Ilya Sutskever? | 11/20/2026 | |
| Anthropic: $41 Million To $33 Billion. Why? | 11/20/2026 | |
| Anthropic At $97: Big IPOs Rewarded Patient Buyers | 11/20/2026 |
| Title | |
|---|---|
| DASHBOARDS |
Research & Analysis
Invest in Strategies
Wealth Management
Peer Comparisons
| Peers to compare with: |
Financials
| Median | |
|---|---|
| Name | |
| Mkt Price | 264.07 |
| Mkt Cap | 2,737.0 |
| Rev LTM | 346,445 |
| Op Inc LTM | 104,366 |
| FCF LTM | 19,747 |
| FCF 3Y Avg | 41,937 |
| CFO LTM | 168,300 |
| CFO 3Y Avg | 137,232 |
Growth & Margins
| Median | |
|---|---|
| Name | |
| Rev Chg LTM | 17.9% |
| Rev Chg 3Y Avg | 16.6% |
| Rev Chg Q | 18.8% |
| QoQ Delta Rev Chg LTM | 4.4% |
| Op Inc Chg LTM | 20.0% |
| Op Inc Chg 3Y Avg | 26.0% |
| Op Mgn LTM | 32.9% |
| Op Mgn 3Y Avg | 32.1% |
| QoQ Delta Op Mgn LTM | 0.2% |
| CFO/Rev LTM | 38.1% |
| CFO/Rev 3Y Avg | 36.1% |
| FCF/Rev LTM | 11.9% |
| FCF/Rev 3Y Avg | 19.1% |
Price Behavior
| Market Price | $97.17 | |
| First Trading Date | 11/19/2026 | |
| Distance from 52W High | 0.0% | |
| 50 Days | 200 Days | |
| DMA Price | ||
| DMA Trend | ||
| Distance from DMA | ||
| 3M | 1YR | |
| Volatility | ||
| Downside Capture | ||
| Upside Capture | ||
| Correlation (S&P 500) |
| 1M | 2M | 3M | 6M | 1Y | 3Y | |
|---|---|---|---|---|---|---|
| Beta | ||||||
| Up Beta | � | � | � | � | � | � |
| Down Beta | � | � | � | � | � | � |
| Up Capture | 0% | 0% | 0% | 0% | 0% | 0% |
| Bmk +ve Days | 12 | 19 | 29 | 63 | 131 | 428 |
| Stock +ve Days | ||||||
| Down Capture | -0% | -0% | -0% | -0% | -0% | -0% |
| Bmk -ve Days | 10 | 24 | 35 | 63 | 120 | 324 |
| Stock -ve Days |
[1] Upside and downside betas calculated using positive and negative benchmark daily returns respectively
Based On 1-Year Data
| Annualized Return | Annualized Volatility | Sharpe Ratio | Correlation with ANT | |
|---|---|---|---|---|
| ANT | - | - | - | - |
| Sector ETF (XLK) | 15.8% | 28.7% | 0.50 | - |
| Equity (SPY) | 9.7% | 13.9% | 0.41 | - |
| Gold (GLD) | -10.5% | 29.0% | -0.39 | - |
| Commodities (DBC) | 28.2% | 21.5% | 1.05 | - |
| Real Estate (VNQ) | 8.8% | 14.3% | 0.34 | - |
| Bitcoin (BTCUSD) | -32.3% | 43.7% | -0.78 | - |
Smart multi-asset allocation framework can stack odds in your favor. Learn How
Based On 5-Year Data
| Annualized Return | Annualized Volatility | Sharpe Ratio | Correlation with ANT | |
|---|---|---|---|---|
| ANT | - | - | - | - |
| Sector ETF (XLK) | 15.1% | 26.6% | 0.51 | - |
| Equity (SPY) | 10.5% | 17.3% | 0.44 | - |
| Gold (GLD) | 14.0% | 19.2% | 0.58 | - |
| Commodities (DBC) | 6.8% | 19.6% | 0.23 | - |
| Real Estate (VNQ) | 0.7% | 19.0% | -0.07 | - |
| Bitcoin (BTCUSD) | -0.6% | 51.4% | 0.17 | - |
Smart multi-asset allocation framework can stack odds in your favor. Learn How
Based On 10-Year Data
| Annualized Return | Annualized Volatility | Sharpe Ratio | Correlation with ANT | |
|---|---|---|---|---|
| ANT | - | - | - | - |
| Sector ETF (XLK) | 22.4% | 25.4% | 0.81 | - |
| Equity (SPY) | 14.5% | 18.0% | 0.68 | - |
| Gold (GLD) | 10.7% | 16.6% | 0.52 | - |
| Commodities (DBC) | 7.2% | 18.2% | 0.31 | - |
| Real Estate (VNQ) | 5.8% | 20.7% | 0.23 | - |
| Bitcoin (BTCUSD) | 56.3% | 66.3% | 0.96 | - |
Smart multi-asset allocation framework can stack odds in your favor. Learn How
Industry Resources
| Information Technology Resources |
| TechCrunch |
| Wired |
| CIO |
| MIT Technology Review |
| Gartner Insights |
| Ars Technica |
| Application Software Resources |
| Capterra |
| Software Advice |
| InfoWorld |
External Quote Links
| Y Finance | Barrons |
| TradingView | Morningstar |
| SeekingAlpha | ValueLine |
| Motley Fool | Robinhood |
| CNBC | Etrade |
| MarketWatch | Unusual Whales |
| YCharts | Perplexity Finance |
| FinViz |
Prefer one of these to Trefis? Tell us why.