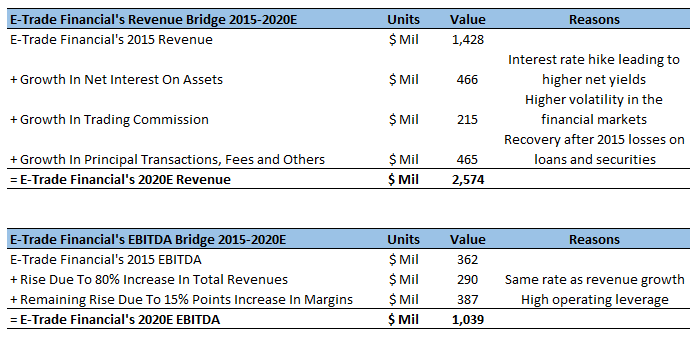
How Is E-Trade Expected To Grow In The Next Five Years?

The Fed’s interest rate hike is likely to boost E-Trade’s net interest revenues, as the company will earn a higher net yield on its assets. Moreover, trade revenues will likely increase in the near term, owing to the volatility and turmoil in the financial markets. In terms of other revenues, a recovery can be expected after the one-time losses on loans and securities of $331 million in 2015. Consequently, we expect a compounded annual growth rate (CAGR) of 12% in total revenues for the 2015-2020 period.
E-Trade’s EBITDA fell over 50% from 2014 to 2015, due to the losses it suffered on loans and securities. However, we expect EBITDA to rise going forward on account of a rebound from these one-off losses. Moreover, since most expenses incurred by the brokerage are fixed in nature, EBITDA margins will also get a boost from higher revenues.
- Coronavirus Recovery Watch: Capital Market Portfolio: 15% 5D Return vs. (-25%) YTD Return – [BlackRock, E*TRADE, Schwab & TD Ameritrade]
- Why Isn’t Charles Schwab’s Stock Benefiting From The Spike In Trading Volumes?
- E*TRADE: Will Lower Trading Commissions Cause Revenues To Be Short Of Consensus Estimates For FY 2019
- Is E*TRADE Stock Fairly Priced?
- Net Interest Revenue Will Form 40%, 60% or 80% Of E-Trade’s Stock In 2020?
- Changing Business Environment Likely To Be A Boon For Schwab and Ameritrade Despite Zero Commissions
Have more questions about E-Trade Financial? See the links below:
- What’s E-Trade’s Revenue And EBITDA Breakdown In Terms Of Different Operating Segments?
- How Has E-Trade’s Revenue Composition Changed Over The Past 5 Years?
- By How Much Has E-Trade’s Revenue & EBITDA Grown In The Last Five Years?
- What Is E-Trade’s Fundamental Value Based On Expected 2016 Results?
- How did E-Trade’s EBITDA Decline Outpace Revenue Decline In 2015?
Notes:
1) The purpose of these analyses is to help readers focus on a few important things. We hope such lean communication sparks thinking, and encourages readers to comment and ask questions on the comment section, or email content@trefis.com
2) Figures mentioned are approximate values to help our readers remember the key concepts more intuitively. For precise figures, please refer to our complete analysis for E-Trade
View Interactive Institutional Research (Powered by Trefis):
Global Large Cap | U.S. Mid & Small Cap | European Large & Mid Cap