Beating S&P500 By 62% Since The Start Of 2023, How Will Snap Stock Trend After Q4 Results?

Snap (NYSE: SNAP) is scheduled to report its fiscal Q4 2023 results on Tuesday, February 6, 2024 (after market close). We expect the stock to beat the consensus estimates of revenues and earnings. The company posted better-than-expected results in the lasdt quarter, with revenues increasing by 5% y-o-y to $1.19 billion. It was mainly due to a 12% y-o-y growth in the average daily active users (DAU), partially offset by a drop in ARPU (average revenue per user) from $3.11 to $2.93. We expect the growth in user base to drive Q4 results. Our interactive dashboard analysis on Snap’s Earnings Preview has more details.
Amid the current financial backdrop, SNAP stock has suffered a sharp decline of 70% from levels of $50 in early January 2021 to around $15 now, vs. an increase of about 30% for the S&P 500 over this roughly 3-year period. However, the decrease in SNAP stock has been far from consistent. Returns for the stock were -6% in 2021, -81% in 2022, and 89% in 2023. In comparison, returns for the S&P 500 have been 27% in 2021, -19% in 2022, and 24% in 2023 – indicating that SNAP underperformed the S&P in 2021 and 2022. In fact, consistently beating the S&P 500 – in good times and bad – has been difficult over recent years for individual stocks; for heavyweights in the Information Technology sector including MSFT, AAPL, and NVDA, and even for the megacap stars GOOG, TSLA, and AMZN. In contrast, the Trefis High Quality (HQ) Portfolio, with a collection of 30 stocks, has outperformed the S&P 500 each year over the same period. Why is that? As a group, HQ Portfolio stocks provided better returns with less risk versus the benchmark index; less of a roller-coaster ride as evident in HQ Portfolio performance metrics. Given the current uncertain macroeconomic environment with high oil prices and elevated interest rates, could SNAP face a similar situation as it did in 2021 and 2022 and underperform the S&P over the next 12 months – or will it see a recovery?
Our forecast indicates that Snap’s valuation is $14 per share, which is 18% below the current market price of around $17.
(1) Revenues expected to edge past the consensus estimates
Snap’s revenues decreased 2% y-o-y to $3.24 billion in the first nine months of 2023. While the company posted growth in terms of daily active users (DAU) on a year-on-year basis, the average revenue-per-user witnessed an unfavorable drop. It was primarily due to tough macroeconomic conditions, leading to a decrease in advertising spending. Overall, we forecast Snap’s revenues to touch $4.63 billion for FY2023.
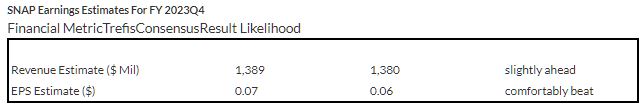
Trefis estimates Snap’s fiscal Q4 2023 net revenues to be around $1.39 billion, marginally above the $1.38 billion consensus estimate.
(2) EPS to beat the consensus estimates
Snap Q4 2022 adjusted earnings per share (EPS) is expected to be $0.07 per Trefis analysis, comfortably beating the consensus estimate of $0.06. The company’s net loss decreased from $1.14 billion to $1.07 billion in the first three quarters of 2023. It was mainly due to higher interest income and other income, offsetting the negative impact of an increase in operating costs as a % of revenues. We expect the net income margin to see some improvement in Q4. Overall, Snap is likely to report an annual GAAP EPS of -$0.80 for FY 2023.
(3) The stock price estimate is 18% below the current market price
We arrive at Snap’s valuation, using a revenue per share (RPS) estimate of around $2.87 and a P/S multiple of just below 5x in fiscal 2023. This translates into a price of $14, which is 18% less than the current market price of $17.
Note: P/E Multiples are based on Share Price at the end of the year and reported (or expected) Adjusted Earnings for the full year
| Returns | Feb 2024 MTD [1] |
Since start of 2023 [1] |
2017-24 Total [2] |
| SNAP Return | 7% | 91% | 17% |
| S&P 500 Return | 2% | 29% | 121% |
| Trefis Reinforced Value Portfolio | 1% | 39% | 614% |
[1] Returns as of 2/5/2024
[2] Cumulative total returns since the end of 2016
Invest with Trefis Market-Beating Portfolios
See all Trefis Price Estimates