Wait For A Dip To Pick Microsoft Stock?

Microsoft’s stock (NASDAQ: MSFT) has surged over 30% in the last six months, fueled by strong quarterly performance, including improving revenue growth and expanding margins. However, with the stock now trading at 37 times its trailing earnings, a key question for investors is whether MSFT remains a good buy.
We believe MSFT stock is currently expensive due to its high valuation. Our conclusion is based on a comprehensive analysis comparing the stock’s current valuation to its recent operating performance, as well as its current and historical financial condition. While our findings show that the company has a strong operating performance and financial condition, the same is reflected in its lofty valuations, as discussed below. That being said, if you seek an upside with less volatility than holding an individual stock, consider the High Quality Portfolio. It has comfortably outperformed its benchmark—a combination of the S&P 500, Russell, and S&P MidCap indexes—and has achieved returns exceeding 91% since its inception. Separately, see – S&P 500 Set To Surge 30%?
Image by efes from Pixabay
Let’s get into details of each of the assessed factors but before that, for quick background: With $3.8 Tril in market cap, Microsoft provides software, services, devices, and solutions, including Office, Microsoft Teams, Windows OEM licensing, and security and compliance tools for productivity and computing needs.
- Is Microsoft Stock Poised for a Rally?
- Buy or Sell Microsoft Stock?
- Microsoft Stock Near Crucial Support – Buy Signal?
- Microsoft Stock Pays Out $376 Bil – Investors Take Note
- Which Software Companies Will Turn “Agentic AI” Into Recurring Revenue?
- Microsoft Stock: Is The 15% Drop A Buying Opportunity Or A Warning Sign?
[1] Valuation Looks Very High
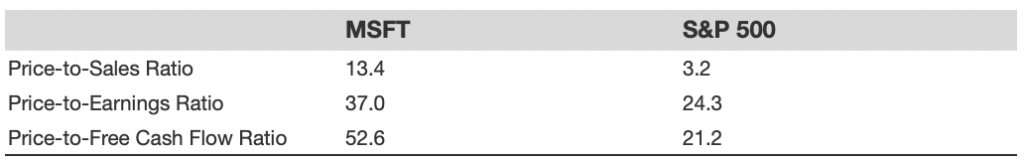
MSFT Valuation
This table highlights how MSFT is valued vs broader market. For more details see: MSFT Valuation Ratios
[2] Growth Is Strong
- Microsoft has seen its top line grow at an average rate of 12.5% over the last 3 years
- Its revenues have grown 15% from $245 Bil to $282 Bil in the last 12 months
- Also, its quarterly revenues grew 18.1% to $76 Bil in the most recent quarter from $65 Bil a year ago.
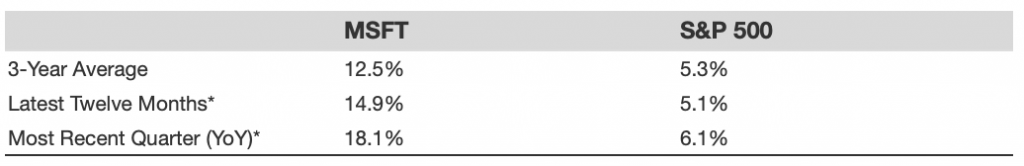
MSFT Revenue Comparison
This table highlights how MSFT is growing vs broader market. For more details see: MSFT Revenue Comparison
[3] Profitability Appears Very Strong
- MSFT last 12 month operating income was $129 Bil representing an operating margin of 45.6%
- With cash flow margin of 48.3%, it generated nearly $136 Bil in operating cash flow over this period
- For the same period, MSFT generated nearly $102 Bil in net income, suggesting net margin of about 36.1%
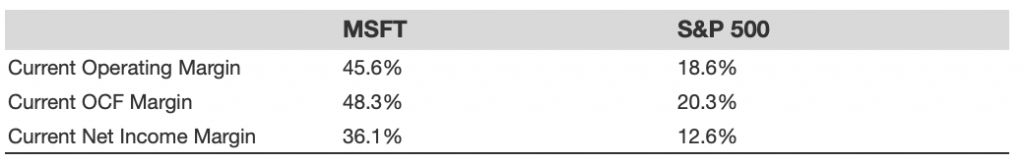
MSFT Operating Income Comparison
This table highlights how MSFT profitability vs broader market. For more details see: MSFT Operating Income Comparison
[4] Financial Stability Looks Very Strong
- MSFT Debt was $61 Bil at the end of the most recent quarter, while its current Market Cap is $3.8 Tril. This implies Debt-to-Equity Ratio of 1.6%
- MSFT Cash (including cash equivalents) makes up $95 Bil of $619 Bil in total Assets. This yields a Cash-to-Assets Ratio of 15.3%
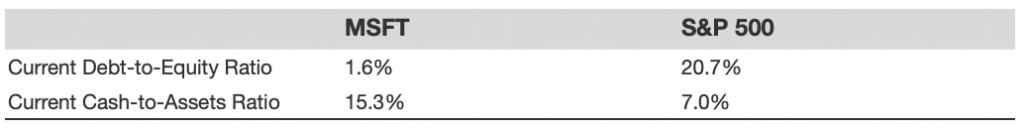
MSFT Financial Stability
[5] Downturn Resilience Is Moderate
MSFT saw an impact slightly better than the S&P 500 index during various economic downturns. We assess this based on both (a) how much the stock fell and, (b) how quickly it recovered.
2022 Inflation Shock
- MSFT stock fell 37.6% from a high of $343.11 on 19 November 2021 to $214.25 on 3 November 2022 vs. a peak-to-trough decline of 25.4% for the S&P 500.
- However, the stock fully recovered to its pre-Crisis peak by 15 June 2023
- Since then, the stock increased to a high of $535.64 on 4 August 2025 , and currently trades at $509.90
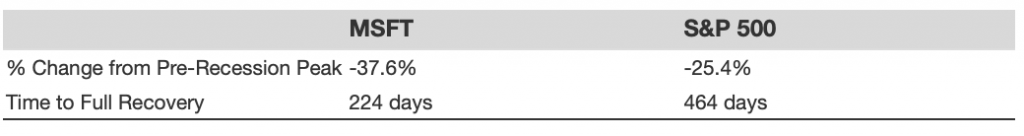
MSFT Stock Performance – 2022 Inflation Shock
2020 COVID-19 Pandemic
- MSFT stock fell 28.2% from a high of $188.70 on 10 February 2020 to $135.42 on 16 March 2020 vs. a peak-to-trough decline of 33.9% for the S&P 500.
- However, the stock fully recovered to its pre-Crisis peak by 9 June 2020
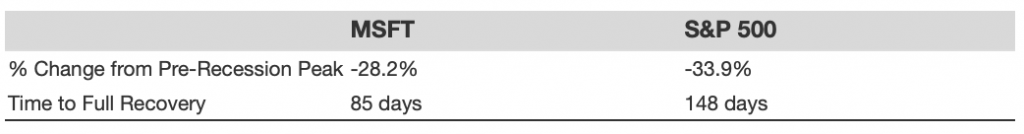
MSFT Stock Performance – 2020 COVID-19 Pandemic
2008 Global Financial Crisis
- MSFT stock fell 59.1% from a high of $37.06 on 1 November 2007 to $15.15 on 9 March 2009 vs. a peak-to-trough decline of 56.8% for the S&P 500.
- However, the stock fully recovered to its pre-Crisis peak by 6 November 2013
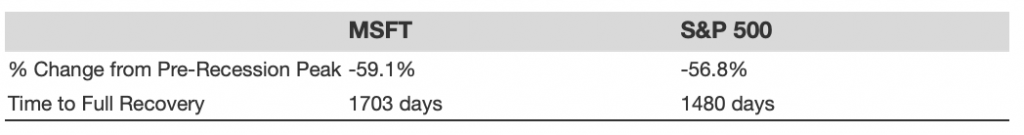
MSFT Stock Performance – 2008 Global Financial Crisis
While Microsoft has performed strongly across key financial and operational metrics, this is already reflected in its current valuation of 37 times earnings. This multiple is higher than that of other major tech stocks, including Amazon, Google, and Meta (look at how Microsoft’s valuation compares against its peers). See, we could be wrong in our assessment. The growth of Azure could justify an even higher multiple in the eyes of some investors. But, we believe that from a risk perspective, a more prudent strategy would be to wait for a price dip before buying MSFT stock.
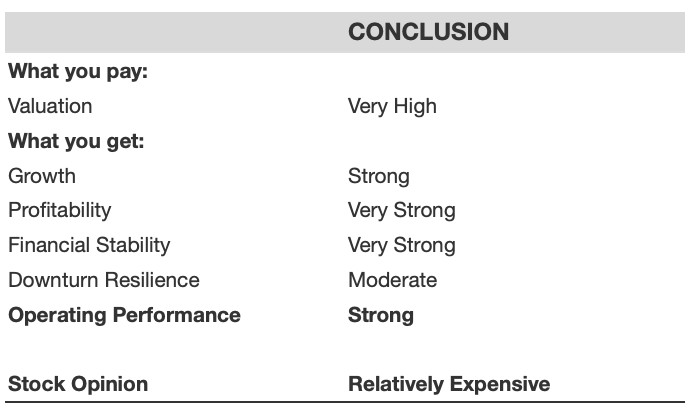
MSFT Stock Opinion
The Trefis High Quality (HQ) Portfolio, with a collection of 30 stocks, has a track record of comfortably outperforming its benchmark that includes all 3 – S&P 500, Russell, and S&P midcap. Why is that? As a group, HQ Portfolio stocks provided better returns with less risk versus the benchmark index; less of a roller-coaster ride, as evident in HQ Portfolio performance metrics.
Invest with Trefis Market-Beating Portfolios
See all Trefis Price Estimates