
Further Upside For Kulicke And Soffa Industries Stock After 27% Rise Last Week?
Kulicke and Soffa Industries Inc. stock (NASDAQ: KLIC) has seen an impressive rise of 27% over the past week and currently trades at $69 per share. Kulicke and Soffa Industries is a leading semiconductor and LED provider, whose stock rally was driven by stellar Q3 2021 earnings released last week, where revenue rose to $424 million, compared to $150 million for the same period last year. Further, with operating expenses in check, operating income rose 11x from $11 million to $120 million. This helped drive EPS from $0.18 to $1.83 over this period.
After the recent rally, will KLIC stock continue its upward trajectory over the coming weeks, or is a correction in the stock more likely? According to the Trefis Machine Learning Engine, which identifies trends in a company’s stock price data for the last ten years, returns for KLIC stock average close to 3.3% in the next one-month (21 trading days) period after experiencing a 26.9% rise over the previous one week (five trading days) period. But how would these numbers change if you are interested in holding KLIC stock for a shorter or a longer time period? You can test the answer and many other combinations on the Trefis Machine Learning Engine to test Kulicke and Soffa Industries stock chances of a rise after a fall and vice versa. You can test the chance of recovery over different time intervals of a quarter, month, or even just one day!
MACHINE LEARNING ENGINE – try it yourself:
IF KLIC stock moved by -5% over five trading days, THEN over the next 21 trading days, KLIC stock moves an average of 5 percent, with a decent 62% probability of a positive return.
Some Fun Scenarios, FAQs & Making Sense of KLIC Stock Movements:
Question 1: Is the average return for KLIC stock higher after a drop?
Answer:
Consider two situations,
Case 1: KLIC stock drops by -5% or more in a week
Case 2: KLIC stock rises by 5% or more in a week
Is the average return for KLIC stock higher over the subsequent month after Case 1 or Case 2?
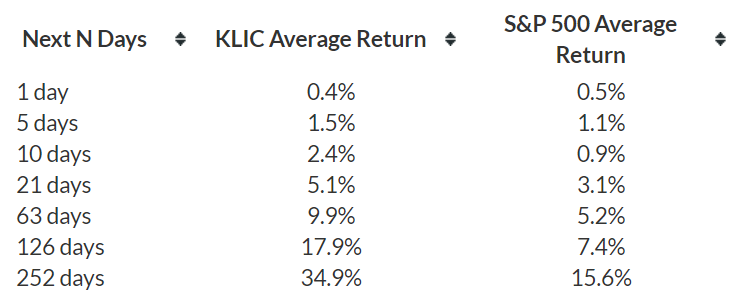
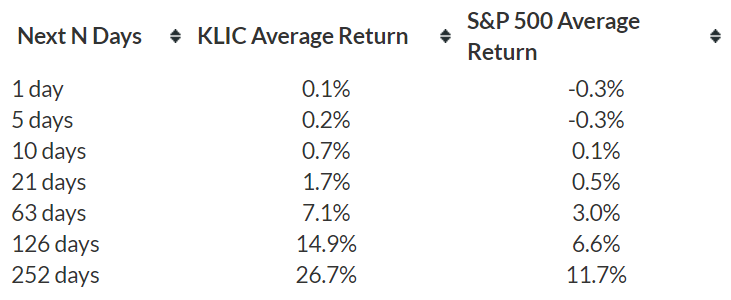
KLIC stock fares better after Case 1, with an average return of 5.1% over the next month (21 trading days) under Case 1 (where the stock has just suffered a 5% loss over the previous week), versus, an average return of 1.7% for Case 2.
In comparison, the S&P 500 has an average return of 3.1% over the next 21 trading days under Case 1, and an average return of just 0.5% for Case 2 as detailed in our dashboard that details the average return for the S&P 500 after a fall or rise.
Try the Trefis machine learning engine above to see for yourself how KLIC stock is likely to behave after any specific gain or loss over a period.
Question 2: Does patience pay?
Answer:
If you buy and hold KLIC stock, the expectation is over time the near-term fluctuations will cancel out, and the long-term positive trend will favor you – at least if the company is otherwise strong.
Overall, according to data and Trefis machine learning engine’s calculations, patience absolutely pays for most stocks!
For KLIC stock, the returns over the next N days after a -5% change over the last five trading days is detailed in the table below, along with the returns for the S&P500:
Question 3: What about the average return after a rise if you wait for a while?
Answer:
The average return after a rise is understandably lower than after a fall as detailed in the previous question. Interestingly, though, if a stock has gained over the last few days, you would do better to avoid short-term bets for most stocks.
KLIC’s returns over the next N days after a 5% change over the last five trading days is detailed in the table below, along with the returns for the S&P500:
It’s pretty powerful to test the trend for yourself for KLIC stock by changing the inputs in the charts above.
What if you’re looking for a more balanced portfolio instead? Here’s a high-quality portfolio that’s beaten the market since 2016.
See all Trefis Price Estimates and Download Trefis Data here
What’s behind Trefis? See How It’s Powering New Collaboration and What-Ifs For CFOs and Finance Teams | Product, R&D, and Marketing Teams