How Will Home Depot Stock React To Its Upcoming Earnings?

Note: Home Depot FY’24 ended on February 2, 2025.
Home Depot (NYSE: HD) is scheduled to release its fiscal second-quarter earnings on Tuesday, August 19, 2025, with analysts projecting earnings of $4.70 per share on $45.37 billion in revenue. This would represent a 2% year-over-year increase in earnings and a 5% increase in sales compared to the prior year’s figures of $4.61 per share and $43.18 billion in revenue. Historically, HD stock has declined 55% of the time following earnings announcements, with a median one-day drop of 2.2% and a maximum observed decline of 9%. Also see, Buy or Sell Home Depot?
In Q1, Home Depot saw solid demand for smaller projects and seasonal events, though high interest rates kept many consumers from undertaking big-ticket renovations. Committed to holding prices despite tariff pressures, the company leverages its scale, supplier relationships, and diversified supply chain to absorb costs and potentially gain market share as rivals raise prices. The company has $400 Bil in current market capitalization. Revenue over the last twelve months was $163 Bil, and it was operationally profitable with $22 Bil in operating profits and net income of $15 Bil. Separately, see Robinhood Stock To $230?
For event-driven traders, historical patterns may offer an edge, whether by positioning ahead of earnings or reacting to post-release moves. That said, if you seek upside with lower volatility than from individual stocks, the Trefis High Quality portfolio presents an alternative, having outperformed the S&P 500 and generated returns exceeding 91% since its inception. See earnings reaction history of all stocks.

Image by Steve Buissinne from Pixabay
Home Depot’s Historical Odds Of Positive Post-Earnings Return
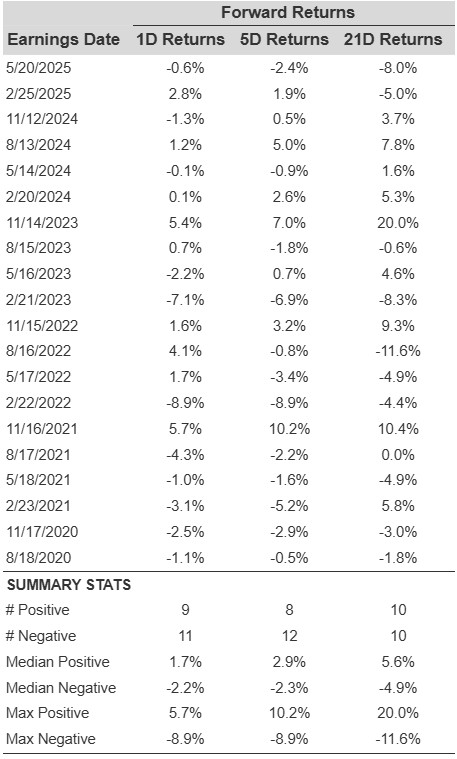
Some observations on one-day (1D) post-earnings returns:
- There are 20 earnings data points recorded over the last five years, with 9 positive and 11 negative one-day (1D) returns observed. In summary, positive 1D returns were seen about 45% of the time.
- Notably, this percentage increases to 58% if we consider data for the last 3 years instead of 5.
- Median of the 9 positive returns = 1.7%, and median of the 11 negative returns = -2.2%
Additional data for observed 5-Day (5D) and 21-Day (21D) returns post earnings are summarized along with the statistics in the table below.
HD Correlation Between 1D, 5D, and 21D Forward Returns
Correlation Between 1D, 5D, and 21D Historical Returns
A relatively less risky strategy (though not useful if the correlation is low) is to understand the correlation between short-term and medium-term returns post earnings, find a pair that has the highest correlation, and execute the appropriate trade. For example, if 1D and 5D show the highest correlation, a trader can position themselves “long” for the next 5 days if 1D post-earnings return is positive. Here is some correlation data based on 5-year and 3-year (more recent) history. Note that the correlation 1D_5D refers to the correlation between 1D post-earnings returns and subsequent 5D returns.
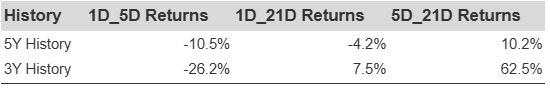
HD Correlation Between 1D, 5D and 21D Historical Returns
Is There Any Correlation With Peer Earnings?
Sometimes, peer performance can have influence on post-earnings stock reaction. In fact, the pricing-in might begin before the earnings are announced. Here is some historical data on the past post-earnings performance of Home Depot stock compared with the stock performance of peers that reported earnings just before Home Depot. For fair comparison, peer stock returns also represent post-earnings one-day (1D) returns.
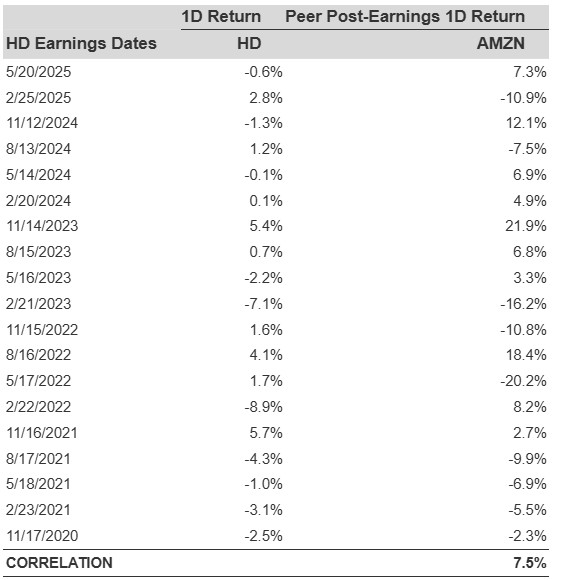
HD Correlation with Peers
Learn more about Trefis RV strategy that has outperformed its all-cap stocks benchmark (combination of all 3, the S&P 500, S&P mid-cap, and Russell 2000), to produce strong returns for investors.
Invest with Trefis Market-Beating Portfolios