Up 19% In A Month, Can Deere Stock Continue Its Run?

Deere stock (NYSE: DE) reported its Q2FY22 results last week, with revenue falling slightly ahead but earnings well below our estimates. DE stock has risen 8% in a week, while it’s up 19% in a month. After the recent rise, we believe DE stock is fully valued, as discussed below.
Deere’s revenue (Q3FY22 equipment revenue) of $13.2 billion was up 25%, while its EPS of $6.16 was up 16% y-o-y, compared to our estimates of $13.0 billion and $6.70, respectively. The revenue growth was driven by solid demand for agriculture equipment, which saw sales rise a significant 32%, while the construction equipment sales were up 8% y-o-y. The operating margin contracted 70 bps due to supply chain issues and inflation.
The company lowered its full-fiscal year guidance with net income expected to be between $7 and $7.2 billion, vs. its prior guidance the $7 and $7.4 billion range. Despite an earnings miss, DE stock has rallied due to a solid performance of its agriculture equipment segment, a trend expected to continue in the near term. The company benefits from the above-average age of farming equipment in the U.S. The demand has also been buoyed by rising agricultural income.
- Should You Pick Deere Stock At $360 After 6% Fall In A Week Amid Downbeat Outlook?
- Down 4% This Week What’s Next For Deere Stock After Downbeat 2024 Guidance?
- Should You Pick Deere Stock At $380 Ahead of Its Q4 Results?
- Are Capital Equipment Stocks Like Deere Worth Buying Despite Rising Interest Rates?
- Should You Buy Deere Stock After A 10% Fall In A Week Despite Solid Q3?
- Is Deere Stock A Better Pick Over KO?
We have updated our model to reflect the latest results. We expect full-fiscal 2022 revenue to be $47.1 billion and earnings to be $23.02 on a per share and adjusted basis. We have revised Deere’s Valuation to be around $396 per share (vs. $410 earlier), which is just 2% above the current market price of $388. At its current levels, DE stock is trading around 17x its expected forward earnings, compared to the last three-year average of 16x, implying that DE stock is fully valued now.
But what about the near-term outlook based on Deere’s recent stock price move?
Now that DE stock has seen a significant rise of 19% in a month, will it continue its upward trajectory, or is a fall imminent? Going by historical performance, there is a higher chance of an increase in DE stock over the next month. A move of 19% or more in a month for Deere has occurred only 34 times in the past ten years. Of those, 22 instances resulted in DE stock rising over the subsequent one-month period (twenty-one trading days). This historical pattern reflects 22 out of 34, or a 65% chance of a rise in DE stock over the coming month. See our analysis on Deere Stock Chance of Rise for more details.
Calculation of ‘Event Probability‘ and ‘Chance of Rise‘ using the last ten years’ data
- After moving 6% or more over five days, the stock rose on 58% of the occasions in the next five days.
- After moving 7% or more over ten days, the stock rose in the next ten days on 55% of the occasions
- After moving 19% or more over a twenty-one-day period, the stock rose on 65% of the occasions in the next twenty-one days.
This pattern suggests a higher chance of a rise in DE stock over the next five days, ten days, and one month.
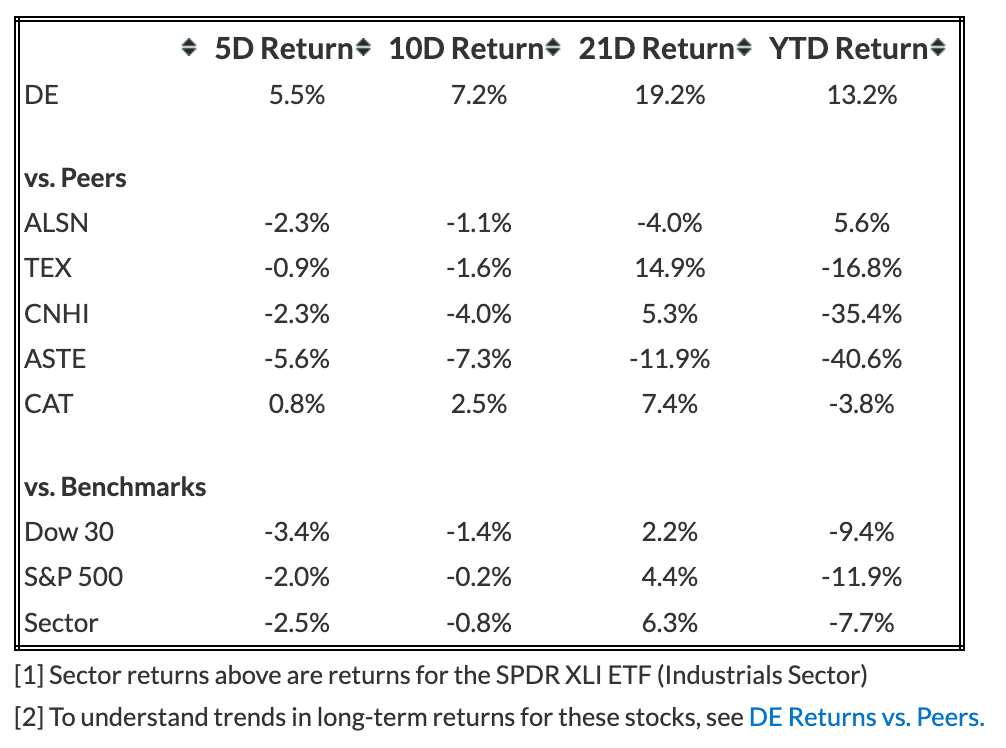
Deere (DE) Return (Recent) Comparison With Peers
- Five-Day Return: DE highest at 5.5%; ASTE lowest at -5.6%
- Ten-Day Return: DE highest at 7.2%; ASTE lowest at -7.3%
- Twenty-One Day Return: DE highest at 19.0%; ASTE lowest at -11.9%
Although DE stock is fully valued in our view, its rise may continue in the near term based on its historical performance. It is helpful to see how Deere’s Peers fare on metrics that matter. You will find other valuable comparisons for companies across industries at Peer Comparisons.
Furthermore, the Covid-19 crisis has created many pricing discontinuities which can offer attractive trading opportunities. For example, you’ll be surprised at how counter-intuitive the stock valuation is for Corning vs. Amerco.
What if you’re looking for a more balanced portfolio instead? Our high-quality portfolio and multi-strategy portfolio have beaten the market consistently since the end of 2016.
| Returns | Aug 2022 MTD [1] |
2022 YTD [1] |
2017-22 Total [2] |
| DE Return | 13% | 13% | 277% |
| S&P 500 Return | 2% | -12% | 88% |
| Trefis Multi-Strategy Portfolio | 2% | -12% | 254% |
[1] Month-to-date and year-to-date as of 8/26/2022
[2] Cumulative total returns since the end of 2016
Invest with Trefis Market-Beating Portfolios
See all Trefis Price Estimates