Why Did Cleveland-Cliffs Stock Drop 12% In A Week?

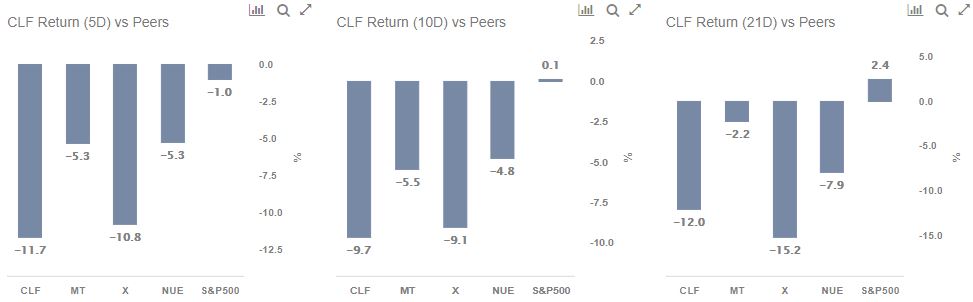
Cleveland-Cliffs stock (NYSE: CLF) dropped almost 12% in just the last one week. In the last ten days it is down almost 10% while if we look at the change over the last one month, the stock is down 12%. The primary reason for the drop has been volatility in commodity prices amidst a resurgence in Covid-positive cases. At the same time, Beijing’s combination of dire warnings about manipulative speculative pricing, restrictions on credit for construction, and pressure on polluting industries to reduce emissions have further fueled volatility in iron ore and steel prices amongst other commodities.
In comparison to CLF’s 12% drop, the broader S&P 500 decreased only 1% over the last one week. When we look at the change over the last one month, CLF stock is down 12% as against a rise of 2.2% in the S&P 500. Now, is CLF stock set to decline further or could we expect some recovery? We believe that there is an equal (50%) chance of a rise in CLF stock over the next month (21 trading days) based on our machine learning analysis of trends in the stock price over the last ten years. See our analysis on CLF Stock Chance of Rise for more details.
- Will Cleveland-Cliffs Stock Move Higher Following Q1 Results?
- What’s New With Cleveland-Cliffs Stock?
- What’s Happening With Cleveland-Cliffs Stock?
- Why We Are Raising Our Price Estimate For Cleveland-Cliffs Despite A Weak Q4
- With Contracted Prices For 2023 Up, Is Cleveland-Cliffs Stock A Buy?
- Company Of The Day: Cleveland-Cliffs
Twenty-One Day: CLF -12%, vs. S&P500 2.2%; Underperformed market
(26% likelihood event; 50% probability of rise over next twenty-one days)
- CLF stock decreased 12% the last twenty-one trading days (one month), compared to broader market (S&P500) rise of 2.2%
- A change of -12% or more over twenty-one trading days is a 26% likelihood event, which has occurred 657 times out of 2516 in the last 10 years
- Of these 657 instances, the stock has seen a positive movement over the next twenty-one trading days on 328 occasions
- This points to a 50% probability for the stock rising over the next twenty-one trading days
Ten Day: CLF -9.7%, vs. S&P500 0.2%; Underperformed market
(21% likelihood event; 47% probability of rise over next ten days)
- CLF stock decreased 9.7% over the last ten trading days (two weeks), compared to broader market (S&P500) rise of 0.2%
- A change of -9.7% or more over ten trading days is a 21% likelihood event, which has occurred 529 times out of 2517 in the last 10 years
- Of these 529 instances, the stock has seen a positive movement over the next ten trading days on 247 occasions
- This points to a 47% probability for the stock rising over the next ten trading days
Five Day: CLF -12%, vs. S&P500 -1%; Underperformed market
(9% likelihood event; 46% probability of rise over next five days)
- CLF stock decreased 12% over a five-day trading period ending 7/16/2021, compared to broader market (S&P500) decline of 1%
- A change of -12% or more over five trading days (one week) is 9% likelihood event, which has occurred 215 times out of 2517 in the last ten years
- Of these 215 instances, the stock has seen a positive movement over the next five trading days on 98 occasions
- This points to a 46% probability for the stock rising over the next five trading days
While CLF stock may have moved, 2020 has created many pricing discontinuities which can offer attractive trading opportunities. For example, you’ll be surprised how the stock valuation for Compass Minerals vs Southwest Gas shows a disconnect with their relative operational growth. You can find many such discontinuous pairs here.
See all Trefis Price Estimates and Download Trefis Data here
What’s behind Trefis? See How It’s Powering New Collaboration and What-Ifs For CFOs and Finance Teams | Product, R&D, and Marketing Teams