How Will Bank of New York Mellon Stock React To Its Upcoming Earnings?

Bank of New York Mellon (NYSE:BK) is set to report its earnings around Tuesday, July 15, 2025. Consensus earnings are pegged at about $1.75 per share, up about 16% compared to last year, while revenues are expected to rise by close to 5%. Growth is likely to be driven by an increase in assets under custody and administration, which topped $53 trillion last quarter, as well as ongoing cost reductions and an increasing focus on higher-margin businesses. Fee-based revenue should benefit from recent market activity. The bank typically earns fees as a percentage of assets under custody, and these revenues are poised to rise due to new client acquisitions. The S&P 500 dropped below 5,000 in early April due to the tariffs imposed by the U.S. on trading partners, before rebounding nearly 25% by the end of June. BNY has previously indicated that a 5% move in equity markets equates to roughly $70 million in fees. The strong market momentum is likely to have helped the company.
The company has $67 billion in current market capitalization. Revenue over the last twelve months was $19 billion, and net income stood at $4.7 billion. That said, if you seek upside with lower volatility than individual stocks, the Trefis High Quality portfolio presents an alternative – having outperformed the S&P 500 and generated returns exceeding 91% since its inception.
See earnings reaction history of all stocks
Bank of New York Mellon’s Historical Odds Of Positive Post-Earnings Return
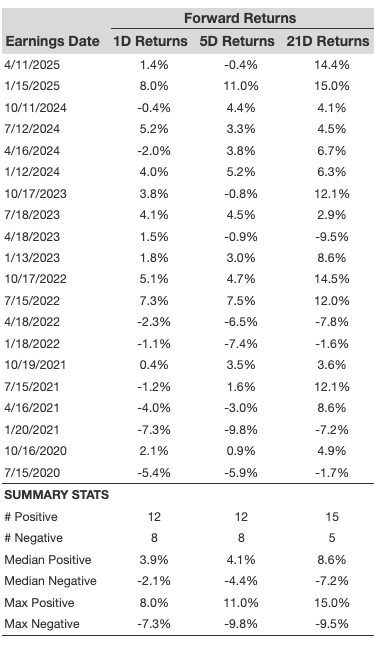
Some observations on one-day (1D) post-earnings returns:
- There are 20 earnings data points recorded over the last five years, with 12 positive and 8 negative one-day (1D) returns observed. In summary, positive 1D returns were seen about 60% of the time.
- Notably, this percentage increases to 83% if we consider data for the last 3 years instead of 5.
- Median of the 12 positive returns = 3.9%, and median of the 8 negative returns = -2.1%
Additional data for observed 5-Day (5D), and 21-Day (21D) returns post earnings are summarized along with the statistics in the table below.
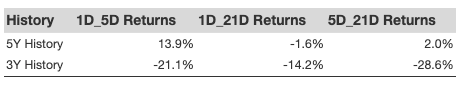
Correlation Between 1D, 5D, and 21D Historical Returns
A relatively less risky strategy (though not useful if the correlation is low) is to understand the correlation between short-term and medium-term returns post earnings, find a pair that has the highest correlation, and execute the appropriate trade. For example, if 1D and 5D show the highest correlation, a trader can position themselves “long” for the next 5 days if 1D post-earnings return is positive. Here is some correlation data based on 5-year and 3-year (more recent) history. Note that the correlation 1D_5D refers to the correlation between 1D post-earnings returns and subsequent 5D returns.
Learn more about Trefis RV strategy that has outperformed its all-cap stocks benchmark (combination of all 3, the S&P 500, S&P mid-cap, and Russell 2000), to produce strong returns for investors. Separately, if you want upside with a smoother ride than an individual stock like Bank of New York Mellon, consider the High Quality portfolio, which has outperformed the S&P, and clocked >91% returns since inception.
Invest with Trefis Market-Beating Portfolios
See all Trefis Price Estimates