
Becton Dickinson (BDX)
Market Price (10/5/2026): $176.8 | Market Cap: $48.6 BilInvestor Relations Sector: Health Care | Industry: Health Care Equipment
Becton Dickinson (BDX)
Market Price (10/5/2026): $176.8Market Cap: $48.6 BilSector: Health CareIndustry: Health Care Equipment
Investment Highlights Why It Matters Detailed financial logic regarding cash flow yields vs trend-riding momentum.
Attractive cash flow generationCFO/Rev LTMCash Flow from Operations / Revenue (Sales), Last Twelve Months (LTM) is 14%, FCF/Rev LTMFree Cash Flow / Revenue (Sales), Last Twelve Months (LTM) is 11%, CFO LTM is 3.3 Bil, FCF LTM is 2.5 Bil Attractive yieldDividend Yield is 2.4%, FCF Yield is 5.2% Stock buyback supportStock Buyback 3Y Total is 1.5 Bil Low stock price volatilityVol 12M is 26% Megatrend and thematic driversMegatrends include Biotechnology & Genomics, Precision Medicine, Digital Health & Telemedicine, and Aging Population & Chronic Disease. Show more. | Weak multi-year price returns2Y Excs Rtn is -37%, 3Y Excs Rtn is -88% | Expensive valuation multiplesP/EPrice/Earnings or Price/(Net Income) is 52x Key risksBDX key risks include [1] execution challenges with the planned separation and combination of its Biosciences and Diagnostic Solutions businesses. |
| Attractive cash flow generationCFO/Rev LTMCash Flow from Operations / Revenue (Sales), Last Twelve Months (LTM) is 14%, FCF/Rev LTMFree Cash Flow / Revenue (Sales), Last Twelve Months (LTM) is 11%, CFO LTM is 3.3 Bil, FCF LTM is 2.5 Bil |
| Attractive yieldDividend Yield is 2.4%, FCF Yield is 5.2% |
| Stock buyback supportStock Buyback 3Y Total is 1.5 Bil |
| Low stock price volatilityVol 12M is 26% |
| Megatrend and thematic driversMegatrends include Biotechnology & Genomics, Precision Medicine, Digital Health & Telemedicine, and Aging Population & Chronic Disease. Show more. |
| Weak multi-year price returns2Y Excs Rtn is -37%, 3Y Excs Rtn is -88% |
| Expensive valuation multiplesP/EPrice/Earnings or Price/(Net Income) is 52x |
| Key risksBDX key risks include [1] execution challenges with the planned separation and combination of its Biosciences and Diagnostic Solutions businesses. |
Qualitative Assessment
AI Analysis | Feedback
Becton Dickinson (BDX) stock has gained about 20% since 6/30/2026 because of the following key factors:
1. Strong Fiscal Q3 2026 Earnings Beat and Positive Outlook.
Becton Dickinson reported robust financial results for fiscal Q3 2026, which ended June 30, 2026, with the announcement on August 6, 2026. The company surpassed analysts' consensus estimates by reporting an adjusted diluted EPS of $3.23, beating expectations of $3.14 by $0.09. Additionally, quarterly revenue reached $4.98 billion, exceeding analyst forecasts of $4.89 billion by $90 million. Following this strong performance, BD raised its full-year fiscal 2026 revenue guidance to the high end of its low-double-digit growth range and increased its adjusted EPS midpoint to a range of $12.62-$12.72.
2. Sustained Positive Analyst Sentiment and Price Target Increases.
Throughout fiscal Q4 2026 (July 1 to September 30, 2026), BDX maintained a favorable view from Wall Street analysts. The stock held a consensus "Buy" or "Moderate Buy" rating across multiple firms. Several analysts adjusted their 12-month price targets upwards during this period, with the average target reaching approximately $195.67 by late September 2026, suggesting a potential upside from the stock's then-current trading levels.
Show more
Becton Dickinson (BDX) stock has gained about 20% since 6/30/2026 because of the following key factors:
1. Strong Fiscal Q3 2026 Earnings Beat and Positive Outlook.
Becton Dickinson reported robust financial results for fiscal Q3 2026, which ended June 30, 2026, with the announcement on August 6, 2026. The company surpassed analysts' consensus estimates by reporting an adjusted diluted EPS of $3.23, beating expectations of $3.14 by $0.09. Additionally, quarterly revenue reached $4.98 billion, exceeding analyst forecasts of $4.89 billion by $90 million. Following this strong performance, BD raised its full-year fiscal 2026 revenue guidance to the high end of its low-double-digit growth range and increased its adjusted EPS midpoint to a range of $12.62-$12.72.
2. Sustained Positive Analyst Sentiment and Price Target Increases.
Throughout fiscal Q4 2026 (July 1 to September 30, 2026), BDX maintained a favorable view from Wall Street analysts. The stock held a consensus "Buy" or "Moderate Buy" rating across multiple firms. Several analysts adjusted their 12-month price targets upwards during this period, with the average target reaching approximately $195.67 by late September 2026, suggesting a potential upside from the stock's then-current trading levels.
3. Strategic Benefits from the "New BD" Restructuring.
The spin-off of BD's Biosciences and Diagnostic Solutions business in February 2026 (fiscal Q2 2026) established a more focused "New BD." This strategic restructuring was anticipated to drive margin expansion and lead to a potential re-rating of the stock's valuation multiple by concentrating on higher-margin segments such as Medical Essentials, Connected Care, Interventional, and BioPharma Systems. The successful execution and perceived advantages of this streamlined operational focus contributed positively to the stock's appreciation during the period.
4. Commitment to Shareholder Returns Through Buyback Program.
Becton Dickinson demonstrated its commitment to enhancing shareholder value by earmarking $2 billion for share buybacks during fiscal year 2026. This significant capital return initiative likely provided underlying support for the share price by reducing the number of outstanding shares and signaling management's confidence in the company's valuation and future prospects.
Show less
Stock Movement Drivers
Fundamental Drivers
The 17.5% change in BDX stock from 6/30/2026 to 10/4/2026 was primarily driven by a 39.2% change in the company's P/E Multiple.| (LTM values as of) | 6302026 | 10042026 | Change |
|---|---|---|---|
| Stock Price ($) | 150.44 | 176.80 | 17.5% |
| Change Contribution By: | |||
| Total Revenues ($ Mil) | 22,993 | 23,250 | 1.1% |
| Net Income Margin (%) | 4.9% | 4.0% | -18.2% |
| P/E Multiple | 37.1 | 51.6 | 39.2% |
| Shares Outstanding (Mil) | 281 | 275 | 2.1% |
| Cumulative Contribution | 17.5% |
Market Drivers
6/30/2026 to 10/4/2026| Return | Correlation | |
|---|---|---|
| BDX | 17.5% | |
| Market (SPY) | 3.1% | 3.4% |
| Sector (XLV) | 4.7% | 65.8% |
Fundamental Drivers
The 13.9% change in BDX stock from 3/31/2026 to 10/4/2026 was primarily driven by a 104.6% change in the company's P/E Multiple.| (LTM values as of) | 3312026 | 10042026 | Change |
|---|---|---|---|
| Stock Price ($) | 155.21 | 176.80 | 13.9% |
| Change Contribution By: | |||
| Total Revenues ($ Mil) | 22,759 | 23,250 | 2.2% |
| Net Income Margin (%) | 7.7% | 4.0% | -47.6% |
| P/E Multiple | 25.2 | 51.6 | 104.6% |
| Shares Outstanding (Mil) | 286 | 275 | 3.9% |
| Cumulative Contribution | 13.9% |
Market Drivers
3/31/2026 to 10/4/2026| Return | Correlation | |
|---|---|---|
| BDX | 13.9% | |
| Market (SPY) | 18.6% | -0.5% |
| Sector (XLV) | 13.8% | 62.7% |
Fundamental Drivers
The 23.2% change in BDX stock from 9/30/2025 to 10/4/2026 was primarily driven by a 98.5% change in the company's P/E Multiple.| (LTM values as of) | 9302025 | 10042026 | Change |
|---|---|---|---|
| Stock Price ($) | 143.54 | 176.80 | 23.2% |
| Change Contribution By: | |||
| Total Revenues ($ Mil) | 19,811 | 23,250 | 17.4% |
| Net Income Margin (%) | 8.0% | 4.0% | -49.4% |
| P/E Multiple | 26.0 | 51.6 | 98.5% |
| Shares Outstanding (Mil) | 287 | 275 | 4.5% |
| Cumulative Contribution | 23.2% |
Market Drivers
9/30/2025 to 10/4/2026| Return | Correlation | |
|---|---|---|
| BDX | 23.2% | |
| Market (SPY) | 16.5% | 16.4% |
| Sector (XLV) | 20.9% | 58.4% |
Fundamental Drivers
The -7.5% change in BDX stock from 9/30/2023 to 10/4/2026 was primarily driven by a -53.7% change in the company's Net Income Margin (%).| (LTM values as of) | 9302023 | 10042026 | Change |
|---|---|---|---|
| Stock Price ($) | 191.08 | 176.80 | -7.5% |
| Change Contribution By: | |||
| Total Revenues ($ Mil) | 19,046 | 23,250 | 22.1% |
| Net Income Margin (%) | 8.7% | 4.0% | -53.7% |
| P/E Multiple | 32.9 | 51.6 | 57.0% |
| Shares Outstanding (Mil) | 286 | 275 | 4.2% |
| Cumulative Contribution | -7.5% |
Market Drivers
9/30/2023 to 10/4/2026| Return | Correlation | |
|---|---|---|
| BDX | -7.5% | |
| Market (SPY) | 86.2% | 26.1% |
| Sector (XLV) | 35.2% | 56.1% |
Price Returns Compared
| 2021 | 2022 | 2023 | 2024 | 2025 | 2026 | Total [1] | |
|---|---|---|---|---|---|---|---|
| Returns | |||||||
| BDX Return | 2% | 5% | -3% | -5% | -13% | 20% | 3% |
| Peers Return | 25% | -17% | 6% | 5% | 10% | -7% | 17% |
| S&P 500 Return | 27% | -19% | 24% | 23% | 16% | 12% | 104% |
Monthly Win Rates [3] | |||||||
| BDX Win Rate | 50% | 58% | 50% | 42% | 58% | 56% | |
| Peers Win Rate | 65% | 42% | 53% | 52% | 50% | 49% | |
| S&P 500 Win Rate | 75% | 42% | 67% | 75% | 67% | 44% | |
Max Drawdowns [4] | |||||||
| BDX Max Drawdown | -10% | -20% | -18% | -10% | -33% | -23% | |
| Peers Max Drawdown | -17% | -30% | -23% | -16% | -22% | -31% | |
| S&P 500 Max Drawdown | -5% | -25% | -10% | -8% | -19% | -9% | |
[1] Cumulative total returns since the beginning of 2021
[2] Peers: TMO, MDT, ABT, DHR, SYK. See BDX Returns vs. Peers.
[3] Win Rate = % of calendar months in which monthly returns were positive
[4] Max drawdown represents maximum peak-to-trough decline within a year
[5] 2026 data is for the year up to 10/2/2026 (YTD)
How Low Can It Go
| Event | BDX | S&P 500 |
|---|---|---|
| 2025 US Tariff Shock | ||
| % Loss | -27.1% | -18.8% |
| % Gain to Breakeven | 37.2% | 23.1% |
| Time to Breakeven | 281 days | 79 days |
| 2022 Inflation Shock & Fed Tightening | ||
| % Loss | -10.1% | -24.5% |
| % Gain to Breakeven | 11.3% | 32.4% |
| Time to Breakeven | 51 days | 427 days |
| 2020 COVID-19 Crash | ||
| % Loss | -21.4% | -33.7% |
| % Gain to Breakeven | 27.2% | 50.9% |
| Time to Breakeven | 24 days | 140 days |
| Q4 2018 Fed Policy Error / Growth Scare | ||
| % Loss | -18.6% | -19.2% |
| % Gain to Breakeven | 22.9% | 23.8% |
| Time to Breakeven | 212 days | 105 days |
| 2015-2016 China Devaluation / Global Growth Scare | ||
| % Loss | -11.9% | -12.2% |
| % Gain to Breakeven | 13.5% | 13.9% |
| Time to Breakeven | 37 days | 62 days |
| 2011 US Debt Ceiling Crisis & European Contagion | ||
| % Loss | -18.3% | -17.9% |
| % Gain to Breakeven | 22.4% | 21.8% |
| Time to Breakeven | 480 days | 123 days |
In The Past
Becton Dickinson's stock fell -27.1% during the 2025 US Tariff Shock. Such a loss loss requires a 37.2% gain to breakeven.
Preserve Wealth
Limiting losses and compounding gains is essential to preserving wealth.
Asset Allocation
Actively managed asset allocation strategies protect wealth. Learn more.
| Event | BDX | S&P 500 |
|---|---|---|
| 2025 US Tariff Shock | ||
| % Loss | -27.1% | -18.8% |
| % Gain to Breakeven | 37.2% | 23.1% |
| Time to Breakeven | 281 days | 79 days |
| 2020 COVID-19 Crash | ||
| % Loss | -21.4% | -33.7% |
| % Gain to Breakeven | 27.2% | 50.9% |
| Time to Breakeven | 24 days | 140 days |
| 2008-2009 Global Financial Crisis | ||
| % Loss | -27.9% | -53.4% |
| % Gain to Breakeven | 38.7% | 114.4% |
| Time to Breakeven | 742 days | 1085 days |
In The Past
Becton Dickinson's stock fell -27.1% during the 2025 US Tariff Shock. Such a loss loss requires a 37.2% gain to breakeven.
Preserve Wealth
Limiting losses and compounding gains is essential to preserving wealth.
Asset Allocation
Actively managed asset allocation strategies protect wealth. Learn more.
About Becton Dickinson (BDX)
Becton Dickinson (BDX) is a global medical technology company dedicated to developing, manufacturing, and selling a comprehensive portfolio of medical supplies, devices, laboratory equipment, and diagnostic products. The company's mission is to advance the world of health by providing essential tools and systems that improve patient care, enhance medical research, and streamline clinical operations for healthcare providers worldwide.
BDX's diverse offerings are organized into three main segments. Its BD Medical segment provides critical medical supplies such as peripheral and central catheters, hypodermic syringes, needles, and sharps disposal systems. This segment also delivers advanced medication management solutions, including IV medication and infusion therapy systems, automated medication dispensing, and specific products for diabetes care like insulin syringes and pen needles.
The BD Life Sciences segment specializes in specimen and blood collection products, along with sophisticated diagnostic systems for blood and tuberculosis culturing, molecular testing, and microorganism identification. It also offers advanced cell sorters, analyzers, and reagents for life science research and clinical diagnostics. Finally, the BD Interventional segment provides products for hernia and soft tissue repair, biosurgery, surgical infection prevention, peripheral intervention devices, and urology and critical care solutions. The company primarily serves healthcare institutions, physicians, life science researchers, clinical laboratories, and the pharmaceutical industry globally.
AI Analysis | Feedback
Grainger for hospitals and medical labs.
Thermo Fisher Scientific for hospital operations and patient care.
AI Analysis | Feedback
- Medical Catheters and Infusion Products: Provides a range of peripheral and advanced catheters, central lines, and IV medication and infusion therapy delivery systems.
- Drug Delivery Systems and Devices: Offers hypodermic syringes, pen needles, prefillable drug delivery systems, and closed-system drug transfer devices.
- Medication Management Systems: Develops automated medication dispensing, supply management, and inventory optimization systems for healthcare institutions.
- Specimen and Blood Collection Products: Manufactures products for collecting blood and other specimens for diagnostic testing.
- Diagnostic Systems: Supplies automated systems for microbiology, molecular testing, microorganism identification, and rapid diagnostic assays.
- Cell Analysis and Research Tools: Provides fluorescence-activated cell sorters, analyzers, antibodies, and reagents for single-cell gene expression analysis and clinical diagnostics.
- Surgical and Interventional Products: Offers products for hernia and soft tissue repair, biosurgery, surgical instrumentation, and peripheral interventions.
- Urology and Critical Care Products: Delivers specialized products for urology and critical care applications.
AI Analysis | Feedback
Becton Dickinson (BDX) primarily sells its products and solutions to other companies and institutions within the healthcare and life sciences sectors, rather than directly to individuals. The company's major customers can be categorized as follows:
- Healthcare Institutions: This broad category includes hospitals, clinics, acute care facilities, long-term care facilities, and physician practices worldwide. These customers purchase a comprehensive range of BD Medical and BD Interventional products, such as catheters, infusion therapy systems, medication management systems, hypodermic needles, surgical products, and critical care solutions.
- Clinical Laboratories: Both independent and hospital-based clinical laboratories are major customers, utilizing BD Life Sciences products for specimen collection, automated blood and tuberculosis culturing, molecular testing, microorganism identification, and liquid-based cytology systems.
- Pharmaceutical Industry: Pharmaceutical companies are key customers for BDX, particularly for prefillable drug delivery systems, as well as laboratory equipment, reagents, and diagnostic products used in drug discovery, development, and manufacturing processes.
- Life Science Research Institutions: This segment includes universities, government research facilities, and biotechnology companies that utilize BD Life Sciences' advanced tools such as fluorescence-activated cell sorters and analyzers, antibodies, and reagent systems for single-cell gene expression analysis and various research applications.
The provided company description does not name specific customer companies or their public symbols, as BDX's customer base within these categories is vast and global.
AI Analysis | Feedback
AI Analysis | Feedback
Tom Polen, Chairman, CEO and President
Tom Polen has over 25 years of experience in the medtech industry. He joined BD in 1999 through an acquired early-phase start-up. Prior to becoming CEO in February 2020 and Chairman in April 2021, he served as President and Chief Operating Officer, and previously as President of the Medical segment. He led the $12 billion acquisition of CareFusion, expanding BD's presence in informatics, healthcare automation, and digital health solutions, and also directed the strategy for the acquisition of C. R. Bard, Inc. Before rejoining BD in 2009, he successfully led Baxter Healthcare's pharmaceuticals businesses. Polen has overseen more than 30 acquisitions during his leadership at BD. He also previously served on the board of directors for Walgreens Boots Alliance.
Vitor Roque, Senior Vice President of Finance, Business Units, Corporate Financial Planning, Analysis and Interim Chief Financial Officer
Vitor Roque was appointed interim Chief Financial Officer effective December 5, 2025. He has been with BD for two decades, holding a broad range of finance leadership roles across regions, business units, and segments, and has supported key acquisitions. Prior to his interim CFO role, he served as the senior vice president responsible for finance in business units and corporate financial planning and analysis.
Elizabeth McCombs, Executive Vice President and Chief Technology Officer
Elizabeth McCombs serves as executive vice president and chief technology officer, responsible for leading all research and development (R&D) activities and advancing new product innovation. She joined BD in 2019 as the Senior Vice President of R&D for the BD Medical Segment. Before BD, she spent over 20 years at Johnson & Johnson (J&J), where her roles included Vice President of R&D for Ethicon, J&J's surgical device franchise, director for the J&J Corporate Office of Science and Technology (COSAT), and R&D leader for the J&J Sports Medicine business.
Roland Goette, Executive Vice President and President of the Europe, Middle East and Africa (EMEA) region
Roland Goette joined BD in 2000 as European marketing manager for Flow Cytometry. He has held various leadership positions with increasing responsibility, including business director of the BD Biosciences business in Eastern Europe, Middle East and Africa, and vice president and general manager of BD Medical Surgical Systems for Central and South Asia, a role that included three years in Singapore. He was instrumental in establishing BD's European headquarters in the Canton of Vaud in 2016 following the acquisition of CareFusion.
Bilal Muhsin, Executive Vice President and President of Future Connected Care Segment
Bilal Muhsin was named Executive Vice President and President of BD's future Connected Care segment, effective July 2, 2025. In this newly created role, he is responsible for advancing BD's Connected Care strategy, which involves shaping organizational capabilities, driving commercial strategy, accelerating innovation, and ensuring operational and quality excellence. His leadership focuses on leveraging advanced analytics and AI solutions with BD's smart devices to enhance patient care efficiency and effectiveness.
AI Analysis | Feedback
- Regulatory and Compliance Risks: Becton Dickinson is subject to extensive regulation by governmental authorities worldwide, particularly the U.S. Food and Drug Administration (FDA). Failure to comply with these regulations, including those related to product approvals, manufacturing quality, and marketing, can lead to severe consequences. Recently, the U.S. Securities and Exchange Commission (SEC) announced settled charges against Becton Dickinson for repeatedly misleading investors about regulatory risks associated with its Alaris infusion pump and for overstating income by not recording costs for fixing software flaws. This resulted in a $175 million civil penalty. Such regulatory non-compliance can lead to product recalls, significant fines, legal liabilities, and damage to the company's reputation.
- Antitrust and Competition Lawsuits: The company faces risks related to allegations of anti-competitive practices. For instance, Tela Bio has filed a lawsuit against Becton Dickinson, alleging anti-competitive behavior in the surgical hernia mesh market, including claims of retaliating against hospitals and using long-term contracts to limit competition. Furthermore, BDX has been subject to federal antitrust lawsuits concerning its syringe and IV catheter markets, accused of suppressing competition and maintaining a monopoly through exclusionary practices. Such litigation can result in substantial financial damages, costly legal battles, and restrictions on business practices.
- Intellectual Property Litigation: Operating in an innovation-driven industry, Becton Dickinson's success relies heavily on its intellectual property, including patents. The company is actively involved in intellectual property disputes, both as a plaintiff and a defendant. For example, Becton Dickinson has filed a federal lawsuit against Baxter International Inc., alleging infringement of six patents related to infusion-pump technologies. Conversely, Becton Dickinson has also been sued for patent infringement regarding its catheter-insertion systems. The costs associated with enforcing or defending intellectual property rights, as well as potential adverse judgments, pose a significant risk to the business.
AI Analysis | Feedback
AI Analysis | Feedback
Becton Dickinson (BDX) operates in several medical technology markets. The addressable markets for its main products and services are sized globally and by region where specified:
BD Medical Segment
- Peripheral Intravenous (IV) Catheters: The global peripheral intravenous catheters (PIVC) market was valued at approximately USD 5.51 billion in 2024 and is projected to reach USD 10.59 billion by 2033. North America held the largest share of 73.1% in this market in 2024. Other estimates place the global peripheral IV catheter market at around USD 5.37 billion in 2024, growing to USD 16.39 billion by 2032. Another source indicates a market size of USD 1.96 billion in 2024, expected to reach USD 3.01 billion by 2032, with North America holding an estimated 38.5% share.
- IV Medication and Infusion Therapy Delivery Systems: The global infusion therapy market was valued at USD 11.7 billion in 2023, with projections to reach USD 15.0 billion by 2030. Other reports indicate the global infusion therapy market size was approximately USD 49.58 billion in 2024 and is projected to reach USD 83.10 billion by 2034, with North America expected to lead. The global Infusion Systems Market was estimated at USD 19.74 billion in 2024 and is projected to reach USD 43.17 billion by 2035, with North America holding a significant share. The Global Infusion Therapy Devices Market is estimated to reach USD 77.65 billion by 2032, and North America is identified as the largest market in 2025.
- Diabetes Care Devices (Syringes, Pen Needles, and Drug Delivery Systems): The global diabetes care devices market size was valued at USD 34.19 billion in 2024 and is estimated to reach USD 62.65 billion by 2033. North America dominated this market, accounting for over 38.6% share in 2024. Other estimates show the market size at USD 35.09 billion in 2025, projected to reach USD 101.54 billion by 2034. Another report calculated the global market at USD 68.57 billion in 2025, expected to reach approximately USD 125.03 billion by 2035, with North America dominating with a 39% share in 2025.
BD Life Sciences Segment
- Specimen and Blood Collection Products: The global specimen collection cards market generated USD 464.6 million in 2024 and is expected to reach USD 621.3 million by 2030. North America was the largest revenue-generating market in 2024, holding a 34.5% share. Another source states the global specimen collection cards market size was valued at USD 441.5 million in 2024 and is projected to reach USD 715.4 million by 2035, with North America dominating in 2024 with a 40.6% revenue share. The specimen collection kit market, which includes a broader range of products, was USD 7.56 billion in 2022 and is expected to reach USD 15.63 billion by 2030, with North America dominating.
- Molecular Diagnostics: The global molecular diagnostics market size was valued at USD 15.78 billion in 2025 and is projected to grow to USD 23.62 billion by 2034. North America dominated with a 42.42% share in 2025. Other estimates place the global market size at USD 45.11 billion in 2025, predicted to increase to approximately USD 66.34 billion by 2035, with North America accounting for over 40% in 2025.
- Microbiology Testing: The global microbiology testing market was valued at USD 5.47 billion in 2024 and is expected to reach USD 10.99 billion by 2032. Another report estimates the global market size at USD 5.80 billion in 2024, predicted to increase to approximately USD 13.73 billion by 2034, with North America leading. The global microbiology testing market size is calculated at USD 5.84 billion in 2024, projected to reach around USD 13.89 billion by 2034, with North America holding a 46% share in 2024.
- Flow Cytometry: The global flow cytometry market size was estimated at USD 4,684.2 million in 2024 and is projected to reach USD 7,013.1 million by 2030. North America dominated with the largest revenue share of 41.35% in 2024. Other estimates value the global market at USD 6.66 billion in 2025, projected to grow to USD 14.12 billion by 2034, with North America dominating with a 39.42% share in 2025.
BD Interventional Segment
- Surgical Mesh (Hernia and Soft Tissue Repair): The global surgical mesh market size was valued at USD 2.39 billion in 2024 and is projected to reach USD 2.81 billion by 2034, with the U.S. remaining the largest market. Another source indicates the global surgical meshes market reached approximately USD 2.02 billion in 2024, expected to grow to USD 2.78 billion in 2029 and USD 3.77 billion in 2034. The Surgical Mesh Market size is expected to grow from USD 2.16 billion in 2022 to USD 3.85 billion by 2030.
- Peripheral Intervention Products: The Peripheral Interventions Market size reached USD 8.7 billion in 2022 and is set to expand to USD 20.6 billion by 2032. North America's peripheral interventions market is poised to amass more than USD 8.1 billion by 2032. The global peripheral interventions market size is USD 11.30 billion in 2025, calculated to reach around USD 54.59 billion by 2034, with North America dominating with a 36% revenue share in 2024. The Peripheral Intervention Market is expected to reach a valuation of USD 11.9 billion by 2032, with North America as the largest market, accounting for approximately 45% of the global share, and Asia-Pacific emerging rapidly with about 20% of the global share.
AI Analysis | Feedback
Becton Dickinson (BDX) is expected to drive future revenue growth over the next 2-3 years through several key strategies and initiatives:
- Strategic Focus on "New BD" and High-Growth MedTech Markets: The company's separation of its Biosciences and Diagnostic Solutions business (combined with Waters Corporation) positions "New BD" as a pure-play medical technology leader. This strategic pivot allows for intensified focus and investment in healthcare providers and patient end-markets, which are projected to have a combined addressable market of over $70 billion with approximately 5% growth. This sharper focus is anticipated to accelerate innovation and enhance margins, thereby supporting revenue expansion.
- Innovation and New Product Introductions in Key Growth Platforms: BD is actively driving growth through the launch and expansion of innovative products across several high-potential areas. This includes strong demand for biologic drug delivery systems, particularly for high-viscosity formulations and large-volume subcutaneous delivery, including GLP-1 therapies, with products like the BD Libertas™ Wearable Injector and BD Neopak™ XtraFlow™ Glass Prefillable Syringe. Additionally, the company is focusing on smart connected care solutions, such as the AI-enabled BD Incada™ Connected Care Platform and the next-generation BD Pyxis™ Pro Automated Medication Dispensing Solution, which aim to enhance medication management and operational efficiency. Strong performance is also expected from advanced tissue regeneration and peripheral intervention products, including the Rotarex™ Atherectomy System and Phasix resorbable mesh, within the BD Interventional segment.
- Operational Efficiency and Reinvestment in Growth Initiatives: The "BD Excellence" operating model is a crucial enabler of revenue growth by driving significant P&L leverage and expanding adjusted gross and operating margins. These efficiency gains and cost optimizations are designed to fuel increased investment in research and development (R&D) and commercial capabilities, directly supporting the development and market penetration of new, revenue-generating products and solutions.
- Strategic Acquisitions for Portfolio Expansion: BD has demonstrated a commitment to inorganic growth through targeted acquisitions. The acquisition of Edwards Lifesciences' Critical Care group, now known as BD Advanced Patient Monitoring, exemplifies this strategy by enhancing the company's smart connected care offerings with advanced monitoring technologies and AI-driven clinical decision tools. Such strategic acquisitions expand BD's portfolio and market reach, contributing to overall revenue growth.
AI Analysis | Feedback
Share Repurchases
- In February 2026, Becton Dickinson completed a share buyback program, initiated in 2021, totaling US$1,307.21 million.
- In January 2026, the Board of Directors authorized the repurchase of up to 10 million additional shares of common stock, augmenting existing authorizations from 2021 and 2025.
- For fiscal year 2025, the company's annual share buybacks amounted to $1 billion. In fiscal year 2024, BDX repurchased $500 million in stock.
Share Issuance
- Becton Dickinson's shares outstanding experienced slight fluctuations within the last three years, increasing by 0.36% in 2023 to 0.288 billion and by 0.91% in 2024 to 0.291 billion.
- For 2025, shares outstanding declined by 0.86% to 0.289 billion.
Outbound Investments
- In September 2024, BD completed the acquisition of Edwards Lifesciences' Critical Care product group, which has been renamed BD Advanced Patient Monitoring. This acquisition expands BD's portfolio with advanced monitoring solutions and AI-enabled clinical decision tools.
- The company completed the acquisition of Parata Systems in July 2022 and Cytognos in February 2022.
- BD also acquired Venclose Inc. in December 2021 and Tepha Inc. in July 2021.
Capital Expenditures
- Becton Dickinson's capital expenditures were $108 million as of March 7, 2026.
- The latest value for Last Twelve Months (LTM) capital expenditure was $208 million as of November 2025.
- The company's strategy involves targeted investments aimed at sustaining growth and improving margins.
Peer Outperformance in Health Care Equipment
| Ticker | Name | Rev Growth 3Y Avg | P/E | 1Y | 3Y | 5Y | 5Y Gap |
|---|---|---|---|---|---|---|---|
| BDX | Becton Dickinson | 7.1% | 51.6x | 19.1% | -8.4% | 3.7% | — |
| ITGR | Integer | 8.4% | 33.5x | 20.4% | 61.4% | 37.1% | +33pp |
| Industry | Names | 1Y med | 3Y med | 5Y med | Top 3 by 5Y |
|---|---|---|---|---|---|
| Health Care Distributors | 6 | 12.8% | 43.2% | 91.3% | CAH 414% · MCK 366% · COR 175% |
| Health Care Services | 20 | 18.8% | 36.3% | 9.1% | HIMS 295% · RDNT 144% · DGX 81% |
| Managed Health Care | 8 | 25.4% | -8.6% | 4.2% | OSCR 92% · HQY 38% · ELV 11% |
| Health Care Facilities | 24 | -2.1% | 5.0% | -3.6% | THC 291% · NHC 272% · ENSG 131% |
| Health Care Equipment ← | 50 | -8.9% | -0.2% | -16.2% | POCI 11050% · UFPT 374% · GKOS 253% |
| Pharmaceuticals | 62 | -7.4% | -2.8% | -30.9% | INDV 1117% · ETON 1046% · LQDA 953% |
| Health Care Supplies | 12 | 21.5% | -4.9% | -37.5% | LNTH 296% · HAE 52% · MMSI 19% |
| Life Sciences Tools & Services | 109 | -5.7% | -11.3% | -66.7% | SNWV 1867% · NTRA 269% · MEDP 210% |
| Health Care Technology | 21 | -35.8% | -55.3% | -79.1% | SPOK 79% · HSTM 10% · VEEV -2% |
| Biotechnology | 362 | -18.3% | -24.6% | -79.3% | CELZ 1252% · ELVN 1139% · DNTH 1108% |
Latest Trefis Analyses
Research & Analysis
Invest in Strategies
Wealth Management
Peer Comparisons
| Peers to compare with: |
Financials
| Median | |
|---|---|
| Name | |
| Mkt Price | 195.44 |
| Mkt Cap | 130.9 |
| Rev LTM | 31,689 |
| Op Inc LTM | 6,381 |
| FCF LTM | 5,799 |
| FCF 3Y Avg | 5,332 |
| CFO LTM | 7,335 |
| CFO 3Y Avg | 6,888 |
Growth & Margins
| Median | |
|---|---|
| Name | |
| Rev Chg LTM | 8.3% |
| Rev Chg 3Y Avg | 5.5% |
| Rev Chg Q | 10.0% |
| QoQ Delta Rev Chg LTM | 2.4% |
| Op Inc Chg LTM | 12.0% |
| Op Inc Chg 3Y Avg | 6.4% |
| Op Mgn LTM | 18.7% |
| Op Mgn 3Y Avg | 18.3% |
| QoQ Delta Op Mgn LTM | 0.2% |
| CFO/Rev LTM | 21.3% |
| CFO/Rev 3Y Avg | 20.1% |
| FCF/Rev LTM | 16.6% |
| FCF/Rev 3Y Avg | 16.0% |
Valuation
| Median | |
|---|---|
| Name | |
| Mkt Cap | 130.9 |
| P/S | 3.9 |
| P/Op Inc | 21.0 |
| P/EBIT | 19.8 |
| P/E | 33.2 |
| P/CFO | 18.1 |
| Total Yield | 4.6% |
| Dividend Yield | 1.8% |
| FCF Yield 3Y Avg | 3.7% |
| D/E | 0.2 |
| Net D/E | 0.2 |
Returns
| Median | |
|---|---|
| Name | |
| 1M Rtn | -5.5% |
| 3M Rtn | 6.7% |
| 6M Rtn | 7.1% |
| 12M Rtn | -4.0% |
| 3Y Rtn | 7.6% |
| 1M Excs Rtn | -5.9% |
| 3M Excs Rtn | 5.5% |
| 6M Excs Rtn | -10.2% |
| 12M Excs Rtn | -17.2% |
| 3Y Excs Rtn | -72.9% |
Comparison Analyses
Segment Financials
Revenue by Segment| $ Mil | 2025 | 2024 | 2023 | 2022 | 2021 |
|---|---|---|---|---|---|
| Medical Essentials | 11,456 | 10,074 | 9,502 | 8,841 | 8,361 |
| Interventional | 5,217 | 4,980 | 4,736 | 4,464 | 4,239 |
| Life Sciences | 5,167 | 5,191 | 5,133 | 5,564 | 6,530 |
| Other | 0 | -67 | 0 | 0 | |
| Total | 21,840 | 20,178 | 19,371 | 18,869 | 19,130 |
| $ Mil | 2025 | 2024 | 2023 | 2022 | 2021 |
|---|---|---|---|---|---|
| Medical Essentials | 4,140 | 3,583 | 3,352 | 2,215 | 1,985 |
| Interventional | 2,253 | 2,115 | 1,939 | 1,081 | 933 |
| Life Sciences | 1,641 | 1,616 | 1,599 | 1,710 | 2,391 |
| Total | 8,034 | 7,314 | 6,890 | 5,006 | 5,309 |
| $ Mil | 2020 | 2019 | 2018 | 2017 | 2016 |
|---|---|---|---|---|---|
| Medical Essentials | 23,007 | 22,925 | 23,493 | 18,332 | 19,154 |
| Interventional | 21,619 | 22,157 | 23,219 | ||
| Life Sciences | 4,713 | 4,135 | 4,225 | 4,056 | 3,848 |
| Corporate administrative and other unallocated | 4,673 | 2,548 | 2,966 | 15,347 | 2,584 |
| Total | 54,012 | 51,765 | 53,903 | 37,735 | 25,586 |
Price Behavior
| Market Price | $176.80 | |
| Market Cap ($ Bil) | 48.6 | |
| First Trading Date | 04/06/1983 | |
| Distance from 52W High | -7.4% | |
| 50 Days | 200 Days | |
| DMA Price | $179.42 | $160.70 |
| DMA Trend | up | up |
| Distance from DMA | -1.5% | 10.0% |
| 3M | 1YR | |
| Volatility | 26.8% | 26.0% |
| Downside Capture | 24.88 | 17.57 |
| Upside Capture | 81.63 | 34.74 |
| Correlation (SPY) | 4.8% | 16.5% |
| 1M | 2M | 3M | 6M | 1Y | 3Y | |
|---|---|---|---|---|---|---|
| Beta | 0.52 | 0.48 | 0.11 | -0.00 | 0.33 | 0.44 |
| Up Beta | -1.54 | -0.52 | -1.29 | -0.10 | 0.20 | 0.44 |
| Down Beta | 0.09 | 1.60 | 0.18 | 0.11 | 0.58 | 0.55 |
| Up Capture | 57% | 89% | 92% | 13% | 31% | 9% |
| Bmk +ve Days | 6 | 16 | 27 | 66 | 132 | 424 |
| Stock +ve Days | 9 | 21 | 34 | 59 | 116 | 361 |
| Down Capture | 129% | 25% | -3% | -26% | 21% | 69% |
| Bmk -ve Days | 16 | 26 | 37 | 60 | 120 | 328 |
| Stock -ve Days | 13 | 21 | 30 | 66 | 134 | 387 |
[1] Upside and downside betas calculated using positive and negative benchmark daily returns respectively
Based On 1-Year Data
| Annualized Return | Annualized Volatility | Sharpe Ratio | Correlation with BDX | |
|---|---|---|---|---|
| BDX | 20.8% | 25.8% | 0.69 | - |
| Sector ETF (XLV) | 17.4% | 15.7% | 0.82 | 58.2% |
| Equity (SPY) | 16.2% | 13.0% | 0.88 | 16.2% |
| Gold (GLD) | 6.8% | 29.6% | 0.22 | 13.7% |
| Commodities (DBC) | 44.9% | 20.8% | 1.67 | -12.7% |
| Real Estate (VNQ) | 1.5% | 13.6% | -0.15 | 39.4% |
| Bitcoin (BTCUSD) | -28.9% | 44.3% | -0.64 | 3.7% |
Smart multi-asset allocation framework can stack odds in your favor. Learn How
Based On 5-Year Data
| Annualized Return | Annualized Volatility | Sharpe Ratio | Correlation with BDX | |
|---|---|---|---|---|
| BDX | -0.1% | 24.0% | -0.04 | - |
| Sector ETF (XLV) | 6.4% | 15.2% | 0.23 | 59.1% |
| Equity (SPY) | 13.1% | 17.2% | 0.58 | 33.7% |
| Gold (GLD) | 18.4% | 18.9% | 0.79 | 11.5% |
| Commodities (DBC) | 10.3% | 19.6% | 0.41 | 1.0% |
| Real Estate (VNQ) | 0.7% | 18.8% | -0.07 | 40.4% |
| Bitcoin (BTCUSD) | 14.6% | 52.2% | 0.45 | 8.8% |
Smart multi-asset allocation framework can stack odds in your favor. Learn How
Based On 10-Year Data
| Annualized Return | Annualized Volatility | Sharpe Ratio | Correlation with BDX | |
|---|---|---|---|---|
| BDX | 4.0% | 23.9% | 0.17 | - |
| Sector ETF (XLV) | 10.4% | 16.7% | 0.50 | 61.5% |
| Equity (SPY) | 15.3% | 17.9% | 0.72 | 42.9% |
| Gold (GLD) | 11.5% | 16.4% | 0.57 | 8.4% |
| Commodities (DBC) | 8.2% | 18.1% | 0.37 | 7.2% |
| Real Estate (VNQ) | 4.2% | 20.7% | 0.16 | 38.6% |
| Bitcoin (BTCUSD) | 64.1% | 66.2% | 1.04 | 5.9% |
Smart multi-asset allocation framework can stack odds in your favor. Learn How
Returns Analyses
Earnings Returns History
Updated 9/9/2026| Forward Returns | |||
|---|---|---|---|
| Earnings Date | 1D Returns | 5D Returns | 21D Returns |
| 8/6/2026 | 3.8% | 7.6% | 9.9% |
| 4/2/2026 | 0.5% | -0.2% | -5.3% |
| 2/9/2026 | -1.3% | 6.5% | -0.1% |
| 10/15/2025 | -0.8% | 0.7% | 3.4% |
| 8/7/2025 | 8.9% | 13.7% | 11.6% |
| 5/1/2025 | -18.1% | -19.3% | -16.7% |
| 2/5/2025 | -7.3% | -7.8% | -6.3% |
| 11/7/2024 | -5.4% | -3.7% | -8.3% |
| ... | |||
| SUMMARY STATS | |||
| # Positive | 8 | 11 | 9 |
| # Negative | 17 | 14 | 16 |
| Median Positive | 3.4% | 2.7% | 4.2% |
| Median Negative | -2.7% | -3.6% | -4.9% |
| Max Positive | 8.9% | 13.7% | 13.8% |
| Max Negative | -18.1% | -19.3% | -16.7% |
| Forward Returns | |||
|---|---|---|---|
| Earnings Date | 1D Returns | 5D Returns | 21D Returns |
| 8/6/2026 | 3.8% | 7.6% | 9.9% |
| 4/2/2026 | 0.5% | -0.2% | -5.3% |
| 2/9/2026 | -1.3% | 6.5% | -0.1% |
| 10/15/2025 | -0.8% | 0.7% | 3.4% |
| 8/7/2025 | 8.9% | 13.7% | 11.6% |
| 5/1/2025 | -18.1% | -19.3% | -16.7% |
| 2/5/2025 | -7.3% | -7.8% | -6.3% |
| 11/7/2024 | -5.4% | -3.7% | -8.3% |
| 8/1/2024 | -2.1% | -3.5% | -0.0% |
| 5/2/2024 | 2.8% | -0.1% | -0.7% |
| 2/1/2024 | 1.5% | 0.3% | -1.5% |
| 11/9/2023 | -9.3% | -8.7% | -8.9% |
| 8/3/2023 | -2.7% | 1.9% | 1.2% |
| 5/4/2023 | -4.2% | -4.8% | -4.5% |
| 2/2/2023 | -2.2% | -1.6% | -6.7% |
| 11/10/2022 | 5.0% | 1.7% | 13.8% |
| 8/4/2022 | 3.1% | 5.6% | 4.2% |
| 5/31/2022 | -1.7% | 0.8% | -3.3% |
| 4/14/2022 | -4.3% | -6.1% | -6.9% |
| 2/3/2022 | 5.4% | 8.0% | 7.3% |
| 11/4/2021 | -1.2% | -0.5% | -1.2% |
| 8/5/2021 | -4.6% | -5.5% | 0.2% |
| 5/6/2021 | -3.6% | -3.3% | -3.6% |
| 2/4/2021 | -2.3% | -3.1% | -5.5% |
| 11/5/2020 | -0.9% | 2.7% | 2.5% |
| SUMMARY STATS | |||
| # Positive | 8 | 11 | 9 |
| # Negative | 17 | 14 | 16 |
| Median Positive | 3.4% | 2.7% | 4.2% |
| Median Negative | -2.7% | -3.6% | -4.9% |
| Max Positive | 8.9% | 13.7% | 13.8% |
| Max Negative | -18.1% | -19.3% | -16.7% |
SEC Filings
Expand for More| Report Date | Filing Date | Filing |
|---|---|---|
| 06/30/2026 | 08/06/2026 | 10-Q |
| 03/31/2026 | 05/07/2026 | 10-Q |
| 12/31/2025 | 02/09/2026 | 10-Q |
| 09/30/2025 | 11/25/2025 | 10-K |
| 06/30/2025 | 08/07/2025 | 10-Q |
| 03/31/2025 | 05/01/2025 | 10-Q |
| 12/31/2024 | 02/06/2025 | 10-Q |
| 09/30/2024 | 11/27/2024 | 10-K |
| 06/30/2024 | 08/01/2024 | 10-Q |
| 03/31/2024 | 05/02/2024 | 10-Q |
| 12/31/2023 | 02/01/2024 | 10-Q |
| 09/30/2023 | 11/21/2023 | 10-K |
| 06/30/2023 | 08/03/2023 | 10-Q |
| 03/31/2023 | 05/04/2023 | 10-Q |
| 12/31/2022 | 02/02/2023 | 10-Q |
| 09/30/2022 | 11/22/2022 | 10-K |
| Report Date | Filing Date | Filing |
|---|---|---|
| 06/30/2026 | 08/06/2026 | 10-Q |
| 03/31/2026 | 05/07/2026 | 10-Q |
| 12/31/2025 | 02/09/2026 | 10-Q |
| 09/30/2025 | 11/25/2025 | 10-K |
| 06/30/2025 | 08/07/2025 | 10-Q |
| 03/31/2025 | 05/01/2025 | 10-Q |
| 12/31/2024 | 02/06/2025 | 10-Q |
| 09/30/2024 | 11/27/2024 | 10-K |
| 06/30/2024 | 08/01/2024 | 10-Q |
| 03/31/2024 | 05/02/2024 | 10-Q |
| 12/31/2023 | 02/01/2024 | 10-Q |
| 09/30/2023 | 11/21/2023 | 10-K |
| 06/30/2023 | 08/03/2023 | 10-Q |
| 03/31/2023 | 05/04/2023 | 10-Q |
| 12/31/2022 | 02/02/2023 | 10-Q |
| 09/30/2022 | 11/22/2022 | 10-K |
| 06/30/2022 | 08/04/2022 | 10-Q |
| 03/31/2022 | 05/05/2022 | 10-Q |
| 12/31/2021 | 02/03/2022 | 10-Q |
| 09/30/2021 | 11/24/2021 | 10-K |
| 06/30/2021 | 08/05/2021 | 10-Q |
| 03/31/2021 | 05/06/2021 | 10-Q |
| 12/31/2020 | 02/04/2021 | 10-Q |
| 09/30/2020 | 11/25/2020 | 10-K |
| 06/30/2020 | 08/06/2020 | 10-Q |
| 03/31/2020 | 05/07/2020 | 10-Q |
| 12/31/2019 | 02/06/2020 | 10-Q |
| 09/30/2019 | 11/27/2019 | 10-K |
Insider Activity
Updated 9/29/2026| # | Owner | Title | Holding | Action | Filing Date | Price | Shares | Transacted Value | Value of Held Shares | Form |
|---|---|---|---|---|---|---|---|---|---|---|
| 1 | Feld, Michael | EVP, Chief Revenue Officer | Direct | Sell | 9292026 | 183.70 | 76 | 13,961 | 3,608,603 | Form |
| 2 | Feld, Michael | EVP, Chief Revenue Officer | Direct | Sell | 8272026 | 188.49 | 165 | 31,101 | 3,717,023 | Form |
| 3 | Polen, Thomas E JR | Chairman, CEO and President | Direct | Sell | 8142026 | 185.00 | 4,152 | 768,120 | 20,380,155 | Form |
| 4 | Goette, Roland | EVP and President, EMEA | Direct | Sell | 8122026 | 180.84 | 2,438 | 440,888 | 2,686,559 | Form |
| 5 | Feld, Michael | EVP, Chief Revenue Officer | Direct | Sell | 7282026 | 157.13 | 75 | 11,785 | 3,289,359 | Form |
| # | Owner | Title | Holding | Action | Filing Date | Price | Shares | Transacted Value | Value of Held Shares | Form |
|---|---|---|---|---|---|---|---|---|---|---|
| 1 | Feld, Michael | EVP, Chief Revenue Officer | Direct | Sell | 9292026 | 183.70 | 76 | 13,961 | 3,608,603 | Form |
| 2 | Feld, Michael | EVP, Chief Revenue Officer | Direct | Sell | 8272026 | 188.49 | 165 | 31,101 | 3,717,023 | Form |
| 3 | Polen, Thomas E JR | Chairman, CEO and President | Direct | Sell | 8142026 | 185.00 | 4,152 | 768,120 | 20,380,155 | Form |
| 4 | Goette, Roland | EVP and President, EMEA | Direct | Sell | 8122026 | 180.84 | 2,438 | 440,888 | 2,686,559 | Form |
| 5 | Feld, Michael | EVP, Chief Revenue Officer | Direct | Sell | 7282026 | 157.13 | 75 | 11,785 | 3,289,359 | Form |
| 6 | Feld, Michael | EVP, Chief Revenue Officer | Direct | Sell | 6262026 | 152.80 | 75 | 11,460 | 3,210,175 | Form |
| 7 | Garrison, Michael David | EVP & Pres Med.Essntl&BioPharm | Direct | Sell | 6252026 | 145.66 | 1,100 | 160,226 | 1,918,634 | Form |
| 8 | Garrison, Michael David | EVP & Pres Med.Essntl&BioPharm | Direct | Sell | 6112026 | 151.48 | 1,100 | 166,628 | 2,161,923 | Form |
| 9 | Polen, Thomas E JR | Chairman, CEO and President | Direct | Sell | 6032026 | 146.35 | 2,764 | 404,511 | 16,122,355 | Form |
| 10 | Feld, Michael | EVP, Chief Revenue Officer | Direct | Sell | 5272026 | 147.35 | 75 | 11,051 | 3,106,727 | Form |
| 11 | Feld, Michael | EVP, Chief Revenue Officer | Direct | Sell | 4282026 | 151.94 | 74 | 11,244 | 3,214,898 | Form |
| 12 | Feld, Michael | EVP, Chief Revenue Officer | Direct | Sell | 3272026 | 156.83 | 75 | 11,762 | 3,329,971 | Form |
| 13 | Feld, Michael | EVP, Chief Revenue Officer | Direct | Sell | 2272026 | 181.84 | 75 | 13,638 | 3,874,647 | Form |
| 14 | Scott, Bertram L | Direct | Sell | 2182026 | 182.61 | 953 | 174,027 | 6,713,291 | Form | |
| 15 | Feld, Michael | EVP, CRO & Pres. Life Sciences | Direct | Sell | 1282026 | 202.73 | 75 | 15,205 | 3,331,057 | Form |
| 16 | Garrison, Michael David | EVP & Pres Med.Essntl&BioPharm | Direct | Sell | 1162026 | 207.46 | 1,610 | 334,005 | 2,509,190 | Form |
| 17 | Feld, Michael | EVP, CRO & Pres. Life Sciences | Direct | Sell | 12292025 | 196.08 | 74 | 14,510 | 3,236,496 | Form |
| 18 | Garrison, Michael David | EVP & Pres Med.Essntl&BioPharm | Direct | Sell | 12172025 | 196.03 | 629 | 123,303 | 2,568,973 | Form |
| 19 | Feld, Michael | EVP, CRO & Pres. Life Sciences | Direct | Sell | 12022025 | 193.36 | 75 | 14,502 | 3,205,909 | Form |
| 20 | Scott, Bertram L | Direct | Sell | 11072025 | 176.58 | 217 | 38,318 | 6,324,389 | Form | |
| 21 | Feld, Michael | EVP & President, Life Sciences | Direct | Sell | 10282025 | 186.01 | 57 | 10,603 | 1,533,652 | Form |
| 22 | Feld, Michael | EVP & President, Life Sciences | Direct | Sell | 9292025 | 181.03 | 58 | 10,500 | 1,502,911 | Form |
| 23 | Fraser, Claire | Direct | Sell | 9112025 | 187.50 | 917 | 171,938 | 4,167,375 | Form |
Investor Activity (13F)
Updated Oct 5, 2026Active managers (13F portfolio over $250M, at least 3 holdings) with a position over $5M that is either over 10% of their portfolio or held in a concentrated book of 50 or fewer total positions. Index/ETF, sovereign, bank, community-bank and charitable/donor-advised filers are excluded.
| Active Manager | Value | % of Portfolio | Total Positions | QoQ | Filing |
|---|---|---|---|---|---|
| Defilade Capital Management, L.P. | $43.9 Mil | 6.2% | 31 | ADD +243.8% | 13F |
| Luxor Capital Group, LP | $38.9 Mil | 6.1% | 38 | New | 13F |
| Longview Partners (Guernsey) LTD | $304.9 Mil | 4.3% | 25 | TRIM -10.2% | 13F |
| Lone Peak Global Investors LLC | $23.1 Mil | 3.9% | 42 | ADD +37.0% | 13F |
| Coleford Investment Management Ltd. | $13.9 Mil | 3.4% | 24 | ADD +97.2% | 13F |
| Southpoint Capital Advisors LP | $157.2 Mil | 3.2% | 41 | TRIM -28.6% | 13F |
| Park West Asset Management LLC | $36.2 Mil | 3.2% | 48 | ADD +64.3% | 13F |
| Sector Gamma AS | $13.0 Mil | 3.1% | 42 | TRIM -37.6% | 13F |
| Nuance Investments, LLC | $16.8 Mil | 2.3% | 43 | TRIM -14.7% | 13F |
| Starboard Value LP | $100.1 Mil | 2.2% | 23 | TRIM -31.6% | 13F |
| Rempart Asset Management Inc. | $9.1 Mil | 1.9% | 36 | TRIM -26.9% | 13F |
| Westchester Capital Management, Inc. | $7.4 Mil | 1.5% | 45 | Hold | 13F |
| Archon Partners LLC | $11.2 Mil | 1.3% | 39 | New | 13F |
| Active Manager | Value | % of Portfolio | Total Positions | QoQ | Filing |
|---|---|---|---|---|---|
| Luxor Capital Group, LP | $38.9 Mil | 6.1% | 38 | New | 13F |
| Archon Partners LLC | $11.2 Mil | 1.3% | 39 | New | 13F |
| Defilade Capital Management, L.P. | $43.9 Mil | 6.2% | 31 | ADD +243.8% | 13F |
| Coleford Investment Management Ltd. | $13.9 Mil | 3.4% | 24 | ADD +97.2% | 13F |
| Park West Asset Management LLC | $36.2 Mil | 3.2% | 48 | ADD +64.3% | 13F |
| Lone Peak Global Investors LLC | $23.1 Mil | 3.9% | 42 | ADD +37.0% | 13F |
| Active Manager | Value | % of Portfolio | Total Positions | QoQ | Filing |
|---|---|---|---|---|---|
| Sector Gamma AS | $13.0 Mil | 3.1% | 42 | TRIM -37.6% | 13F |
| Starboard Value LP | $100.1 Mil | 2.2% | 23 | TRIM -31.6% | 13F |
| Southpoint Capital Advisors LP | $157.2 Mil | 3.2% | 41 | TRIM -28.6% | 13F |
| Rempart Asset Management Inc. | $9.1 Mil | 1.9% | 36 | TRIM -26.9% | 13F |
| Nuance Investments, LLC | $16.8 Mil | 2.3% | 43 | TRIM -14.7% | 13F |
| Longview Partners (Guernsey) LTD | $304.9 Mil | 4.3% | 25 | TRIM -10.2% | 13F |
| Active Manager | Value | % of Portfolio | Total Positions | QoQ | Filing |
|---|---|---|---|---|---|
| Longview Partners (Guernsey) LTD | $304.9 Mil | 4.3% | 25 | TRIM -10.2% | 13F |
| Southpoint Capital Advisors LP | $157.2 Mil | 3.2% | 41 | TRIM -28.6% | 13F |
| Starboard Value LP | $100.1 Mil | 2.2% | 23 | TRIM -31.6% | 13F |
| Defilade Capital Management, L.P. | $43.9 Mil | 6.2% | 31 | ADD +243.8% | 13F |
| Luxor Capital Group, LP | $38.9 Mil | 6.1% | 38 | New | 13F |
| Park West Asset Management LLC | $36.2 Mil | 3.2% | 48 | ADD +64.3% | 13F |
| Lone Peak Global Investors LLC | $23.1 Mil | 3.9% | 42 | ADD +37.0% | 13F |
| Nuance Investments, LLC | $16.8 Mil | 2.3% | 43 | TRIM -14.7% | 13F |
| Coleford Investment Management Ltd. | $13.9 Mil | 3.4% | 24 | ADD +97.2% | 13F |
| Sector Gamma AS | $13.0 Mil | 3.1% | 42 | TRIM -37.6% | 13F |
| Archon Partners LLC | $11.2 Mil | 1.3% | 39 | New | 13F |
| Rempart Asset Management Inc. | $9.1 Mil | 1.9% | 36 | TRIM -26.9% | 13F |
| Westchester Capital Management, Inc. | $7.4 Mil | 1.5% | 45 | Hold | 13F |
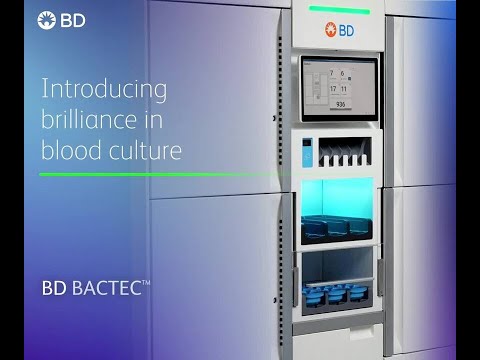
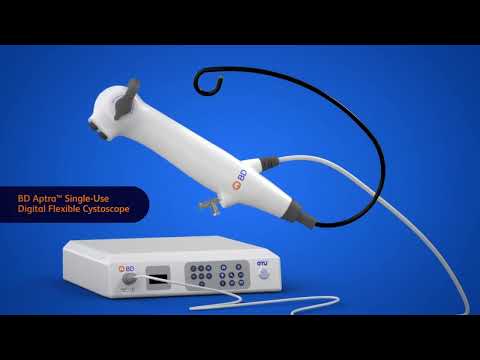
Becton Dickinson — Investor Video Playlist




External Quote Links
| Y Finance | Barrons |
| TradingView | Morningstar |
| SeekingAlpha | ValueLine |
| Motley Fool | Robinhood |
| CNBC | Etrade |
| MarketWatch | Unusual Whales |
| YCharts | Perplexity Finance |
| FinViz |
Prefer one of these to Trefis? Tell us why.