How Low Can Google Stock Go?

That recent dip was a tremor. A real market shock hits this stock hard, and the climb back can take years.
Alphabet (GOOGL) stock’s 5.0% drop on June 22nd, 2026, felt sharp, driven in part by headlines regarding key AI talent departures and broader sector capex anxieties, yet underlying operations remain robust: its latest earnings call reported that search queries are at an all-time high, while Google Cloud revenue soared 63% on strong demand for its AI solutions.
Yet the market is weighing that strong growth against the substantial investment required to fuel it. Management confirmed they are “compute constrained in the near term” and plan for 2027 capital spending to “significantly increase,” raising questions about the cost of the AI race. This makes the real risk question urgent: when the whole market falls, how far does the stock fall with it, and how does that volatility impact an unhedged portfolio?
How Far Google Stock Falls When Markets Drop
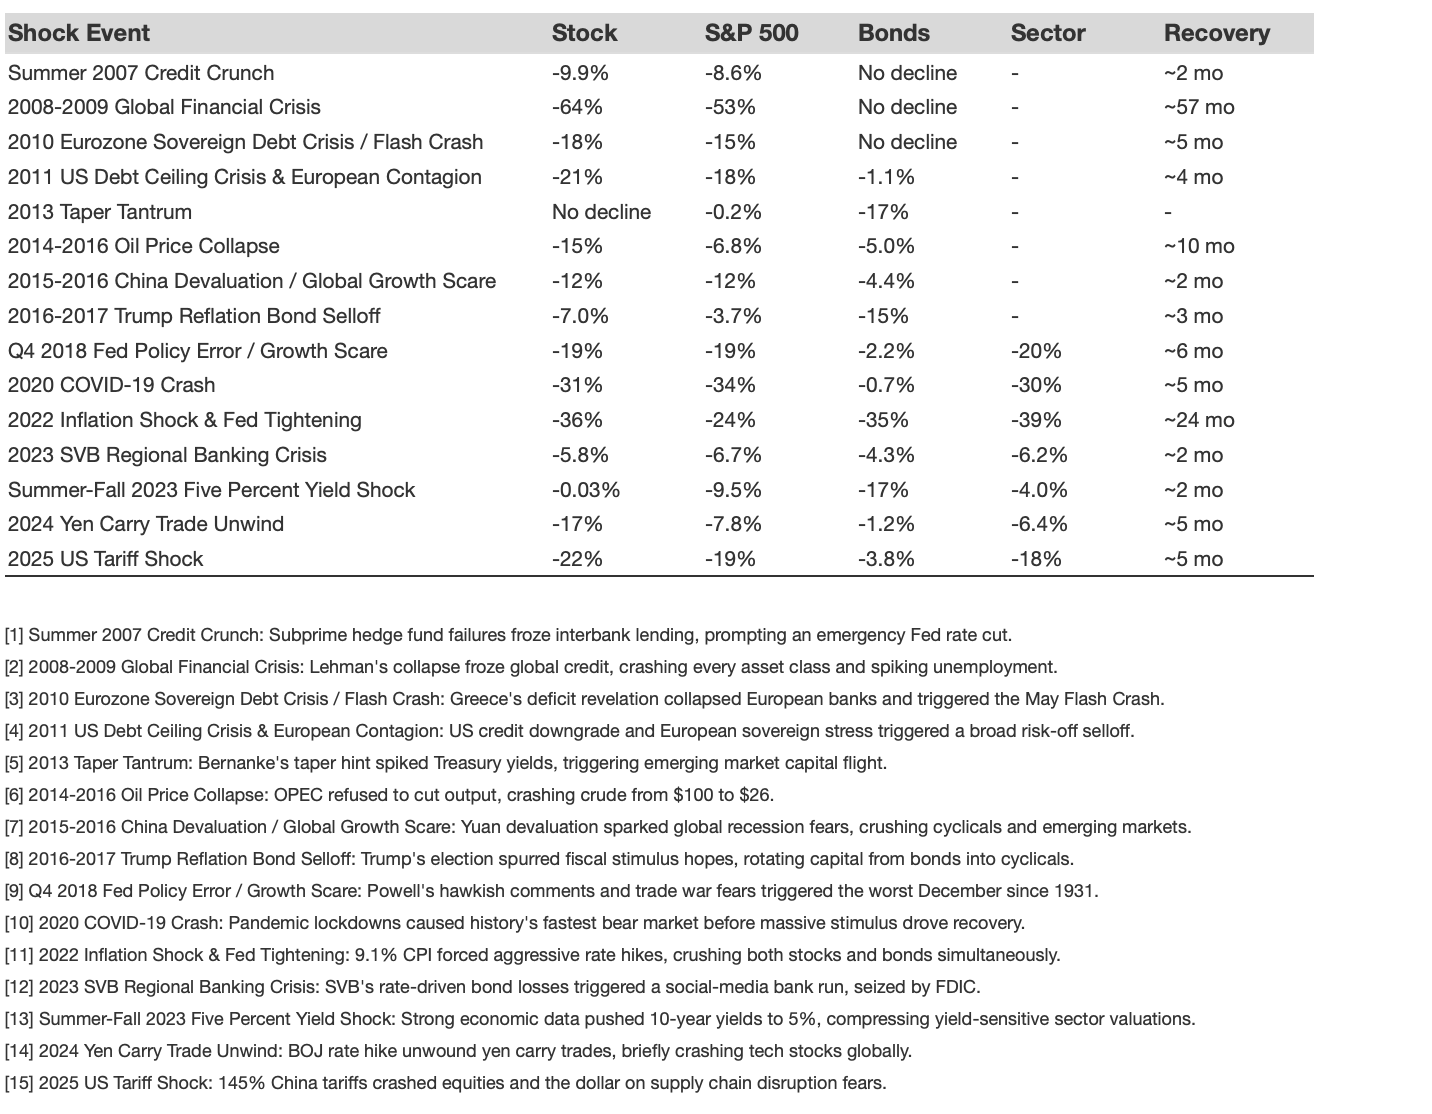
When market shocks hit, Google stock doesn’t sidestep them. Across the 15 major shocks it has traded through, the stock’s average peak-to-trough fall was about 19%, a bit deeper than the S&P 500’s 16% drop. But averages hide the extremes. Its single deepest drawdown was a painful 64% during the 2008-2009 Global Financial Crisis.
- Why SanDisk Stock’s Flat Production Is Its Most Bullish Signal
- The One Metric That Makes Costco Wholesale Stock Vulnerable
- Seagate Stock’s Unfilled Orders Were The Real Tell
- The Number That Could Test AbbVie Stock
- How HCA Stock’s Quiet Compounding Changes The Growth Story
- American Electric Power Stock’s Independent Current
Historically, the stock has been hit hardest during “Credit & Liquidity Crises.” That’s not an abstract category; it includes real, memorable events like the Summer 2007 Credit Crunch, the Global Financial Crisis, and a 2023 regional banking crisis. This is the scale of risk to internalize. Also, see: Is IBM Stock A Buy At $265?
Bounce Back Or Long Slog For Google?
Surviving the fall is one thing; waiting for the recovery is another. The time it takes for Google stock to climb back to its pre-shock high can test an investor’s patience. The typical recovery has taken a median of about 5 months, which feels manageable.
However, the slowest recovery on record tells a different story. After the 2008-2009 Global Financial Crisis, it took about 57 months, nearly five years, for the stock to reclaim its prior peak. A history of bouncing back is encouraging, but it offers no guarantees for the next downturn.
Every Major Shock Google Has Traded Through
Peak-to-trough drawdown in each shock, and how long the stock took to reclaim its pre-shock high. Stock vs. the S&P 500, long-duration bonds, and its sector.
Is Today’s Google A Different Company?
Of course, the Google of 2008-2009 is not the Alphabet of today. The business is vastly larger, with operating margins at a 3-year peak. On its latest call, management highlighted notable momentum, with Google Cloud revenue up 63% and its backlog nearly doubling to $462 billion, driven by enterprise AI demand. Search usage is at an all-time high, and the company is actively reducing the cost of its core AI responses.
But new strengths come with new risks. The company is “compute constrained” and plans for 2027 capital expenditures to “significantly increase,” signaling a period of unprecedented investment. While this spending fuels growth, it also creates uncertainty about future returns. The historical pattern of falling with the market still seems a reasonable baseline.
Separately, see our take on: Will The Stock Split Spark CrowdStrike’s Next Big Run?
Could You Ride Out Google Stock’s Next Drop?
So, can you ride it out? Translate the history into portfolio impact. That deepest 64% drawdown would have cut about 6% from an entire portfolio if Google were a 10% position. At a 20% weight, that hit becomes about 13%. The one lever you truly control is not the market’s next move, but your own exposure.
A disciplined approach to position sizing and genuine diversification across your holdings is the most sensible response to this kind of specific, quantifiable risk. The key thing to watch is how that heavy capital spending translates to profitable growth.
That discipline is exactly what the Trefis High Quality (HQ) Portfolio is built to deliver: it pairs the upside of strong businesses with the stability of a 30-stock portfolio, sized and re-balanced with discipline, and has a track record of outpacing a benchmark that combines all major indices – the S&P 500, S&P Mid-cap, and Russell 2000. Pairing a concentrated holding with an approach like this is how you keep compounding without a single drawdown derailing the plan.