Will Deere Stock See Higher Levels Following Its Q1 Results?

Deere & Company (NYSE: DE) is scheduled to report its fiscal first-quarter results on Friday, Feb 18. We expect Deere to post revenues and earnings below the consensus estimates. While a gradual opening up of the economies with a rise in vaccination rates has resulted in a sharp rebound in overall equipment demand over the recent quarters, the wide spread of Omicron and higher raw material costs, and supply chain headwinds, likely weighed on the overall growth for Deere.
That said, our forecast indicates that Deere’s valuation is $434 per share, which is around 11% above the current market price of $391. Our interactive dashboard analysis of Deere’s Earnings Preview has additional details.
- Should You Pick Deere Stock At $360 After 6% Fall In A Week Amid Downbeat Outlook?
- Down 4% This Week What’s Next For Deere Stock After Downbeat 2024 Guidance?
- Should You Pick Deere Stock At $380 Ahead of Its Q4 Results?
- Are Capital Equipment Stocks Like Deere Worth Buying Despite Rising Interest Rates?
- Should You Buy Deere Stock After A 10% Fall In A Week Despite Solid Q3?
- Is Deere Stock A Better Pick Over KO?
(1) Revenues expected to be below the consensus estimate
- Trefis estimates Deere’s Q1 fiscal 2022 total revenues to be around $8.3 billion, slightly below the consensus estimate of $8.4 billion.
- The company saw a strong rebound in demand for construction and agriculture equipment over the last few quarters, a trend that likely got disrupted with the Omicron spread and an inflationary environment over the latest quarter.
- Furthermore, low inventory levels, loss of a few weeks of production, and tough price comparison to the prior-year quarter may impact the overall growth.
- In its previous quarter earnings conference call, the company’s management stated that it expects the equipment revenue to be similar to the levels of $8.1 billion seen in Q1FY21.
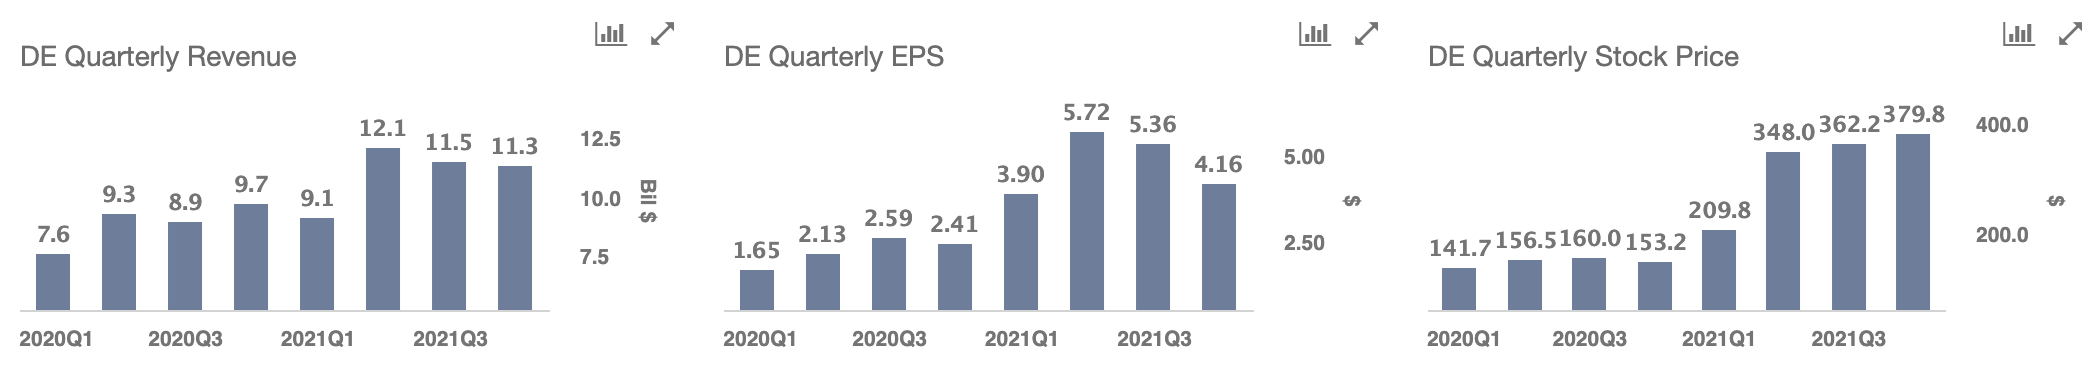
- Looking at the last quarter, Deere’s equipment revenue rose 19% to $10.3 billion, as the company continued to see an increase in spending on agricultural equipment as well as a rebound in construction equipment demand.
- Diving into segments, construction and forestry sales were up 14% y-o-y, while agriculture-related equipment sales were up 21%. Our dashboard on Deere Revenues provides more details on segment-wise revenue breakup.
(2) EPS likely to be below the consensus estimates
- Deere’s Q1 fiscal 2022 earnings per share (EPS) is expected to be $2.20 per Trefis analysis, marginally below the consensus estimate of $2.23.
- Deere’s net income of $1.3 billion in Q4 reflected a large 69% growth from its $757 million profit in the prior-year quarter, led by higher sales and a 150 bps rise in operating margin.
- While Deere saw a higher price realization over the recent quarters, aiding the overall margins, Q1 may see some pressure on margins, given a tough comparison to the prior-year quarter, which benefited from favorable tax items, and due to the inflationary headwinds.
- Looking at the full fiscal 2022, we expect EPS to be $22.30, compared to $18.99 seen in fiscal 2021.
(3) DE stock has more room for growth
- We estimate Deere Valuation to be $434 per share, reflecting an 11% upside from its current market price of $391.
- This represents a P/EBITDA multiple of 13x based on Deere’s EBITDA for the last twelve months.
- While there is an upside potential of around 11%, investors are likely to be better off waiting for Q1 results. If Deere posts downbeat results, as we anticipate, DE stock may trade lower, giving a better buying opportunity for investors looking for long-term gains.
While DE stock is likely to trade lower in the near term, our analysis on Deere vs. Thermo Fisher Scientific finds TMO, with a similar revenue base, to be a better bet. Check out how Deere’s Peers fare on metrics that matter. You will find other valuable comparisons for companies across industries at Peer Comparisons.
What if you’re looking for a more balanced portfolio instead? Here’s a high-quality portfolio that’s beaten the market consistently since the end of 2016.
| Returns | Feb 2022 MTD [1] |
2022 YTD [1] |
2017-22 Total [2] |
| DE Return | 4% | 14% | 279% |
| S&P 500 Return | -2% | -7% | 97% |
| Trefis MS Portfolio Return | 1% | -9% | 258% |
[1] Month-to-date and year-to-date as of 2/15/2022
[2] Cumulative total returns since the end of 2016