Ride sharing company Lyft recently filed for an IPO, making public the S-1 it had confidentially filed with the SEC a few months back. The company is reportedly aiming for a valuation of $20 – 25 billion, and could go public within the next month. Lyft was valued at $15.1 billion in its most recent funding round, a $600 million Series I announced in June 2018 and led by Fidelity. While Lyft is growing revenues at an extremely rapid pace, it is still losing a significant amount of money (both on a net income and cash flow basis) and remains EBITDA negative. Even so, we expect significant investor demand, which should push the valuation to the higher end of the targeted range (before taking into account a potential post-IPO pop).
Our interactive dashboard Estimating Lyft’s Valuation breaks down the company’s key value drivers and our forecasts for the near term, as well as our valuation estimate for Lyft, which is nearly $23 billion. You can modify these metrics to arrive at your own estimate for Lyft’s valuation, and see more Trefis technology company data here.
Overview Of Operations, Key Metrics
Lyft generates revenues every time a user gets a ride via its smartphone app. While most of the revenues go to the driver, the company generates between 20% and 30% in net revenues per ride (nearly 27% in 2018). Lyft currently only operates in the U.S. and Canada, as opposed to Uber’s wider global presence – indicating that it still has substantial growth potential if it expands further internationally, though there are some risks involved with that strategy (as Uber has seen in several markets).
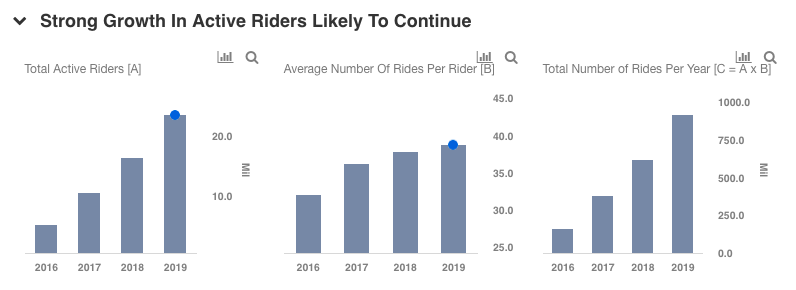
Lyft saw over 100% growth in total active riders in 2017, and another 60% for 2018, reaching a total of over 16 million. Its average rides per user figure is also growing, albeit at a much slower pace. Overall we forecast total rides to increase nearly 50% to over 900 million for 2019, compared to 65% growth in 2018.
Based on Lyft’s reported number of rides and revenues, the average gross revenue per Lyft ride comes out to around $13 for 2018, and we expect a marginal increase in this figure in the near term. As mentioned above, Lyft’s cut of its gross revenue stood at nearly 27% for 2018, up from 23% in 2017 driven by improved utilization and efficiency – including better driver incentive efficiency – and a boost in commissions and services fees. The company mentioned in its S-1 that the figure may fluctuate in future periods and could potentially decline in future years due to incentives, fluctuations in utilization as well as potential competitive pressure. For the sake of conservatism, we forecast a marginal decline in Lyft’s take rate going forward.

Based on our estimates for the total number of rides, gross revenue per ride and Lyft’s cut of gross revenues, we forecast Lyft’s net revenues to reach about $3 billion in 2019, up from $2.2 billion in 2018. This would represent year-on-year growth of about 40%, compared to 100% in 2018. That is still an impressive figure considering the large existing revenue base.

Based on our net revenue estimate of $3 billion for 2019 and estimated forward revenue multiple of 7.5X for Lyft, our valuation estimate for Lyft comes out to nearly $23 billion, which is around the midpoint of the reported targeted IPO range. You can modify the valuation multiple – or any other key forecasts – in our interactive dashboard to see the impact that any changes would have on Lyft’s valuation.
Lyft’s competitor Uber commanded a revenue multiple of around 6x based on its $72 billion valuation in its latest funding round in 2018 (see How Uber Could Justify A $120 Billion Valuation) and its 2018 revenues of $11.3 billion. While Lyft’s higher growth rate and expansion potential – in addition to the scandals that Uber has dealt with over recent years, though they are largely behind the company at this point – justify a slightly higher revenue multiple for Lyft than Uber, the latter’s sheer size and dominant position keep it close in our view.
Path To Profitability?
One item that stands out from Lyft’s S-1 is the magnitude of the company’s net losses. At $911 million, the company’s 2018 net loss would apparently be the largest ever for a company at the time of an IPO, which will undoubtedly be a concern for many public market investors. Further, Lyft’s cash burn remains significant – on a free cash flow basis, it lost nearly $350 million in 2018. And while a substantial portion of its $68 million in 2018 capital expenditures was related to the purchase of a scooter fleet (likely a non-recurring item going forward), it still lost $280 million in operating cash flow. It also remains significantly EBITDA negative, with 2018 EBITDA of ($943.5 million) down significantly from ($696 million) in 2017. All of these factors will surely lead to concerns about whether the company can achieve profitability – or even positive EBITDA – over the coming years.
Despite all of those risks and concerns, Lyft still has strong growth prospects, since it has not yet expanded internationally and continues to invest heavily in its autonomous vehicle strategy, which holds significant promise. Sustained strong revenue growth and a long-term path towards profitability will remain key to Lyft’s valuation, and if it is able to deliver them in the coming years, our forward revenue multiple of 7.5x may look overly conservative.
What’s behind Trefis? See How it’s Powering New Collaboration and What-Ifs:
For CFOs and Finance Teams | Product, R&D, and Marketing Teams
Like our charts? Explore example interactive dashboards and create your own.