Price Reductions Powered Yelp’s Q1 Revenues, But The Company Needs To Do More To Achieve Its Full-Year Growth Target

Yelp (NYSE:YELP) reported its first quarter earnings on Thursday, May 9. The company beat consensus revenue expectations, while delivering an in-line EPS number. One of the highlights of the quarter was that the company entered into lower price-point products like Verified License and Business Highlights to widen its user base. Also, the company reported higher ad volumes per dollar which indicates a reduction in cost per click. While these efforts have boosted revenues in certain categories, they could potentially lead to a higher cash burn for the company in the near future. Also taking into account the fact that the company has seen some weakness in its short-term customer retention rate due to the ongoing transition away from long-term contracts, pricing discipline will be critical for Yelp to achieve long-term revenue growth.
Our interactive dashboard on Yelp’s Price Estimate outlines our forecasts and estimates for the company. You can modify any of the key drivers to visualize the impact of changes on its valuation, and see more Trefis Technology company data here.
- Yelp Stock Up 66% Since 2023. Does It Have More Room To Run Post Q4 Results?
- What To Expect From Yelp’s Q3 After Stock Up 50% This Year?
- Yelp Stock is Up 60% So Far. What’s Next?
- Yelp Stock Down 14% Over Six Months. What’s Next?
- Yelp Stock To Likely Trade Lower Post Q4
- Yelp’s Stock Down 19% This Year, What’s Next?
A Quick Look At Yelp’s Revenue Sources
Yelp connects businesses and consumers in the U.S., and makes money by selling advertising space on its platform. Yelp has a single operating and reporting segment; however, the company breaks down its revenue ($943 million in 2018) into three sub-segments based on the type of service provided:
- Advertising (2018 revenue of $907 million, 96% of total): The company offers to build free profiles for businesses and provides various related services (including branded profiles, enhanced profiles, verification tags, search and ads) on a paid basis.
- Transactions (2018 revenue of $14 million, ~1% of total): Yelp earns commissions on transactions that the company facilitates across the Yelp Platform, Eat24 and the partnership with Grubhub, Yelp Deals and Gift certificates.
- Other services (2018 revenue of $22 million, ~2% of total): Other services revenue is generated through subscription, licencing payments for access to Yelp data, and revenue from partnerships.
Yelp added $227 million in total revenues from 2016 to 2018 (CAGR of 15%)
- Revenue growth was driven by the advertising segment, with growth in active advertiser accounts partially offset by weakness in average revenue per advertiser
- Transaction and other services revenues have declined over this period due to sale of Eat24 business
How Did Yelp Perform in Q1?
Summary of Q1 business performance:
- Paying advertiser accounts grew to 192,000 (+8% y-o-y)
- Advertising revenue increased to $227 million (+6% y-o-y), driven by an 8% y-o-y increase in paying advertiser accounts despite a 2% y-o-y decrease in average revenue per account
- Transaction and other revenues declined to $9 million (-1% y-o-y)
- Total revenue grew to $236 million (+6% y-o-y)
- Net income margin was 0.6% versus net losses, a year ago
Guidance: Yelp’s management re-iterated that its revenue growth rate over coming years will be in the mid-teens, with the growth rate for 2019 expected to be in the pegged at 8-10%. However, with Q2 expectations for revenue growth being 4-6%, the latter half of the year is likely to be a much more demanding period for the company if it is to achieve its growth target.
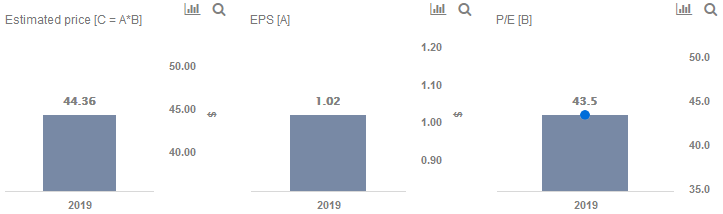
We forecast Yelp’s EPS figure for full-year 2019 to be $1.02. Taken together with our forward P/E multiple of 43 for the company, this works out to a $44 per share price estimate for the company’s stock, which is around 10% higher than the current market price.
Do not agree with our forecast? Create your own price forecast for the Yelp by changing the base inputs (blue dots) on our interactive dashboard.
What’s behind Trefis? See How It’s Powering New Collaboration and What-Ifs
For CFOs and Finance Teams | Product, R&D, and Marketing Teams
All Trefis Data
Like our charts? Explore example interactive dashboards and create your own.