What’s Weather Got To Do With The Coronavirus Spread?

Much has been discussed about the relationship between the temperature and the spread of the Coronavirus over recent weeks – more specifically if the pandemic will slow down as the mercury rises. While there doesn’t appear to be much scientific evidence that this could be the case, colder places have generally been worse affected by the disease.
In this analysis, we take a look at how Coronavirus infections have trended in two of the colder U.S. states – New York and Michigan – and contrast it with the relatively warmer states Florida and California. To be sure, there are factors that we have not accounted for in the following analysis, such as population density, the adoption of social distancing and other public health interventions that could be meaningfully impacting the difference in numbers between states. However, the numbers do provide some insights into the relationship between weather and COVID-19 numbers.
Our dashboard analysis Coronavirus: Trends Across Key U.S. States breaks down key trends across states, including total cases, daily additions, as well as growth rates. Parts of the analysis are summarized below.
- Down 9% Since The Beginning of 2023, What Should You Expect From Exxon Mobil Stock?
- Will Exxon Mobil Stock Trade Higher Post Q2?
- What’s Happening With Exxon Mobil Stock?
- Exxon Mobil Stock Likely To Trade Lower Post Q4
- What To Expect From Exxon Mobil’s Stock Post Q2?
- Can Amazon Stock Add Two Exxon Mobils To Its Market Capitalization?
Among the badly impacted U.S. states, colder states have a higher number of cases & much faster growth rates
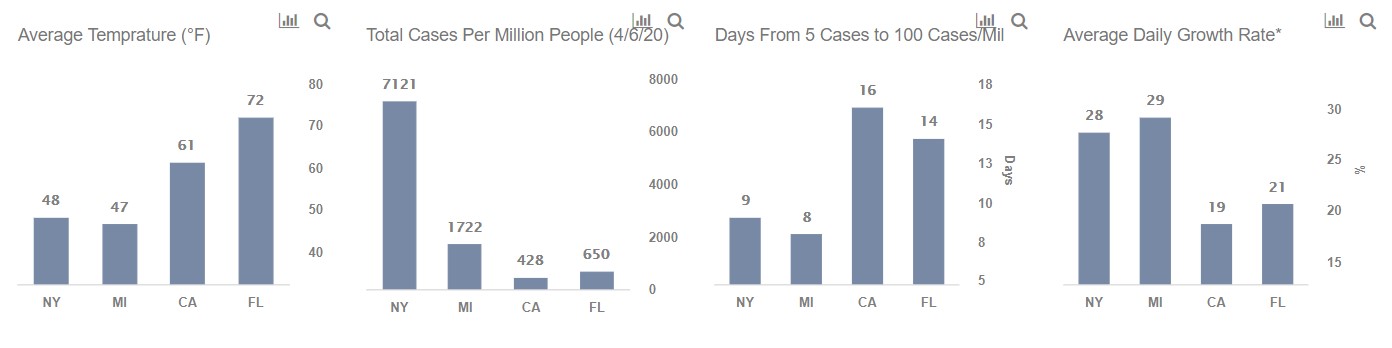
- New York, which has an average temperature of 48°F, had 7,121 cases per million people as of 4/6. The number grew* at a rate of about 28% a day.
- Michigan, which has an average temperature of about 47°F had 1722 cases per million people as of 4/6. The number grew* at a rate of about 29% a day.
- In comparison, California, which has an average temperature of about 61°F, had a total of 430 cases per million people. The number grew* at about 19% per day.
* Daily Growth Rate of Total Cases calculated as the rate of growth from when a state crossed 5 cases per million to the number of cases per million as of 4/6/2020.
Other key metrics also seem to indicate a faster spread in colder states
- It took NY just 9 days to go from 5 cases per million people to 100 cases per million. In comparison, it took 16 days for California and 14 days for Florida
- New York added about 8,000 new cases on 4/6, compared to 1,750 for Michigan, 900 for Florida, and 1,500 in California.
- New York had 139k cumulative cases as of 4/6, compared to 19k for Michigan, 15k for Florida, and 17k for California.
- New York had a total of 7,100 cases per million people, compared to ~1,900 for Michigan, ~690 for Florida, and ~430 for California.
See all Trefis Price Estimates and Download Trefis Data here
What’s behind Trefis? See How It’s Powering New Collaboration and What-Ifs For CFOs and Finance Teams | Product, R&D, and Marketing Teams