Does US Steel Look Expensive At $7 Despite Dropping 40% In 2020?

After almost a 40% decline in US Steel’s (NYSE: X) stock price since the beginning of this year, at the current price of $7 per share, we believe US Steel’s stock is likely to remain around the current level considering the impact of the ongoing coronavirus crisis. The stock is down more than 80% compared to where it was at the end of 2017, a little over 2 years ago. Our dashboard What Factors Drove -80.3% Change In United States Steel Stock Price Between 2017 And Now? provides the key numbers behind our thinking, and we explain more below.
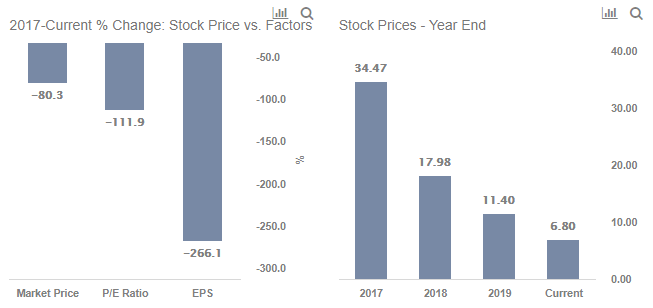
The stock price declined by 67% from $34.47 at the end of 2017 to $11.40 at the end of 2019. This is justified by the 256% decline in net income margin from 3.5% in 2017 to -5.5% in 2019. This was marginally offset by 4% increase in US Steel’s revenue during the 2-year period. This led to a 266% drop in EPS from $2.21/share in 2017 to -$3.67/share in 2019. Due to loss reported by the company in 2019, US Steel’s P/E multiple was negative (which does not hold any significance).
- Can U.S. Steel Stock Return To Pre-Inflation Shock Highs?
- What’s Happening With U.S. Steel Stock?
- Will U.S. Steel Stock Continue To Outperform Despite Economic Headwinds?
- Is U.S. Steel Set For Tough Q3 Results?
- Why We Are Cutting Our Price Estimate For U.S. Steel Stock
- How Will U.S. Steel Stock Fare In An Uncertain Economy?
Revenue increased sharply in 2018 due to higher steel prices but saw a drop in 2019. The biggest drag on the top line in 2019 has been the European division, which saw a whopping 25% decline in revenues, followed by US Flat-Rolled and Tubular divisions which declined ~3.5%. Also, total revenue declined in 2019 on the back of loss of volume from ongoing repair works at Great Lakes Works facility. This was exacerbated by an unfavorable pricing environment on the back of the US-China trade war. The sharp drop in net income was driven by higher cost per unit due to drop in volume sold and lower prices, along with higher restructuring charges.
However, the further drop of 40% in stock price in 2020 was mainly due to the impact of the coronavirus crisis, which we explain below.
Effect of Coronavirus
The global spread of coronavirus has led to lockdown in various cities across the globe, which has affected industrial and economic activity. The steel demand from industry players affects global steel price levels, in turn impacting the company’s price realization for its products. Lower demand from construction and automobile players, has led to a drop in global steel prices recently, which had already seen a drop due to the US-China trade war. Additionally, with the outbreak and spread of coronavirus expected to lead to further slowdown in economic activity and demand, steel prices are expected to remain under pressure in the near term. We believe US Steel’s Q1 results will confirm the hit to its revenue. It is also likely to accompany a lower Q2 and lower 2020 guidance.
US Steel’s stock is down by over 25% since January 31 after the World Health Organization (WHO) declared a global health emergency in light of the spread of coronavirus. However, during the same period, the S&P 500 index saw a decline of about 15%. Thus, US Steel’s stock has performed worse than the broader market during this crisis so far. If there are signs of containment of the virus around the Q1 earnings announcement, there is a possibility of a healthy upside for the stock. On the contrary, in the absence of any clear signs of virus containment by the end of April, the stock could see a downside and hover around a level of $5-$6 per share.
View our dashboard analysis Coronavirus Trends Across Countries, And What It Means For The U.S. for the current rate of coronavirus spread in the U.S. and forecasts on where it could be headed, based on comparison with other countries. Our dashboard -28% Coronavirus crash vs 4 Historic crashes builds a more complete macro picture of historic crashes and how the sell-off during early March compares.
See all Trefis Price Estimates and Download Trefis Data here
What’s behind Trefis? See How It’s Powering New Collaboration and What-Ifs For CFOs and Finance Teams | Product, R&D, and Marketing Teams