A Closer Look At Walmart’s Valuation

Walmart‘s (NYSE: WMT) stock price has fluctuated between $83 and $105 since the beginning of fiscal 2019 (fiscal year ends January), despite strong financial results. This was largely due to a relative slowdown in the company’s e-commerce growth in fiscal 2019 so far (33% – 43%), which compared to 50%+ levels in the first three quarters of fiscal 2018 ending January 2018. In addition, Walmart’s shareholders also seem to be concerned about the company’s shrinking margins and increased costs.
In its recent earnings, the company’s revenues increased 1% year over year (y-o-y) to $125 billion, driven by growth in the domestic market due to its marketplace offerings. In addition, Walmart’s adjusted EPS grew by 8% y-o-y to $1.08. Walmart U.S. also delivered a strong top-line performance, with comparable sales of 3.4%, driven by a 1.2% increase in customer traffic and a 2.2% growth in ticket size in Q3. Globally, on a constant currency basis, the company’s e-commerce sales increased 43% in the quarter. Going forward, we expect the company to continue to post an increase in its revenue growth rate, driven by growth across operating segments. We also expect the GAAP earnings pressure to continue, due to investments in technology and a rise in employee wages. In addition, we expect online grocery to drive some growth for the company, though the accompanying expenses could result in further margin pressure.
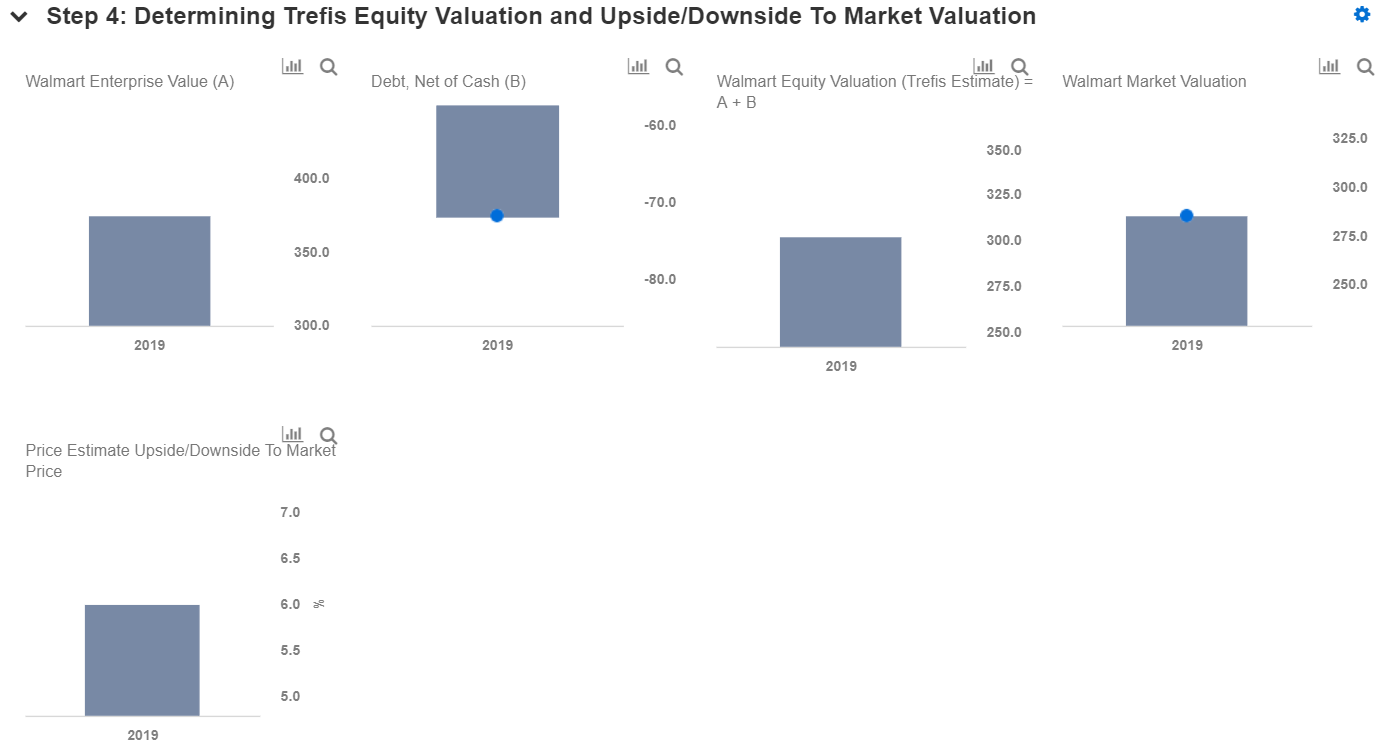
We have summarized our forecasts in our interactive dashboard on Walmart’s Fundamental Value. You can modify assumptions such as changes in expected segment revenue or EBITDA margins to see how they impact the company’s value. The charts below show some of the key steps in identifying Walmart’s valuation sensitivity to changes in its segment revenues. We detail how changes in revenue or segment EBITDA margin impacts total EBITDA, which in turn impacts its enterprise value (assuming a constant EBITDA multiple). We have maintained our long-term price estimate for Walmart at $103, which is slightly ahead of the current market price.
- Where Is Walmart Stock Headed Post Stock Split?
- Up 7% Already This Year , Where Is Walmart Stock Headed Post Q4 Results?
- Up 18% This Year, Will Walmart Stock Continue To Grow Past Q3?
- Can Walmart’s Stock Trade Lower Post Q2?
- Walmart Stock Likely To See Little Movement Post Q1
- Walmart Stock To Trade Lower Post Q3 Results?
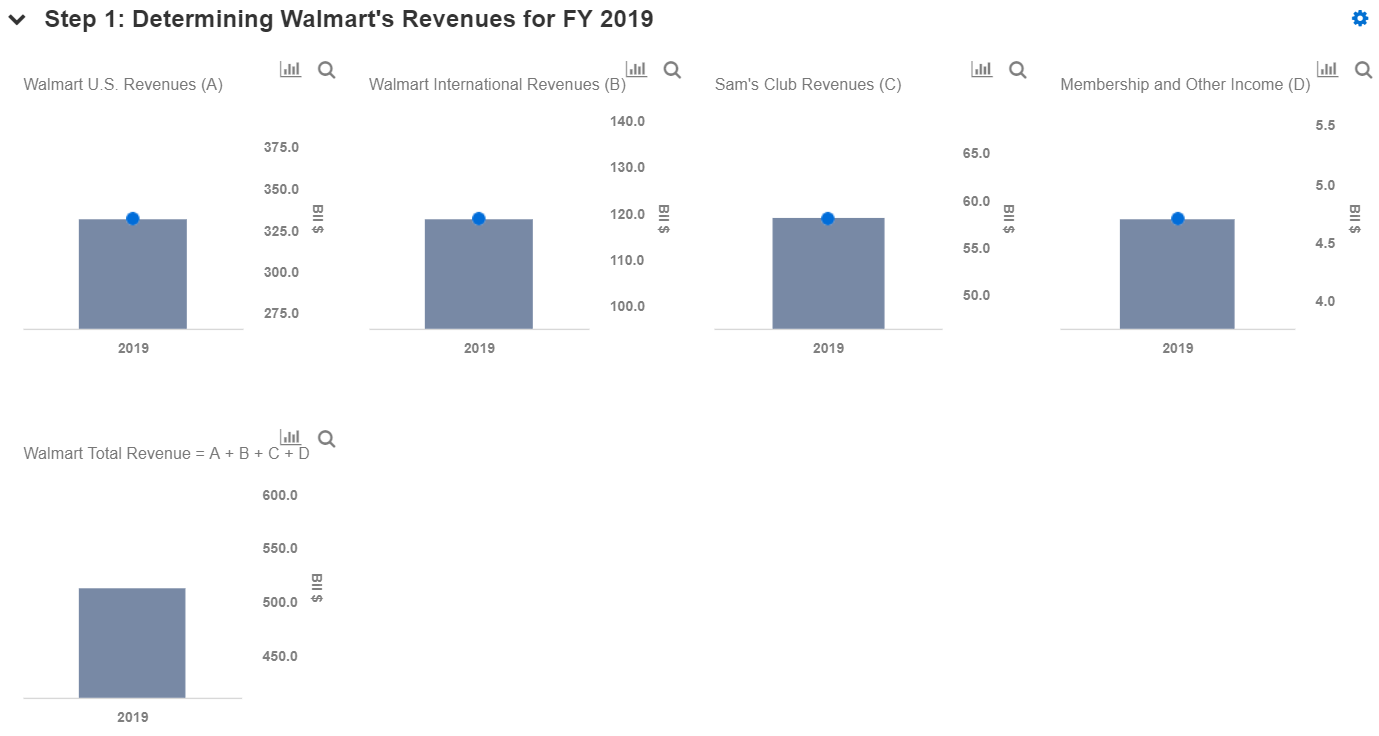


Detailing Forecasts For Walmart
We expect Walmart to generate around $513 billion in revenues in fiscal 2019, and earnings of almost $14 billion. Of the total expected revenues in fiscal 2019, we estimate $331 billion in the Walmart U.S. business, almost $119 billion for the Walmart International business, and nearly $58 billion for the Sam’s Club business. Further, we have calculated the retailer’s divisional revenues by estimating the number of stores, square footage per store and revenue per square foot in fiscal 2019. We expect Walmart’s fiscal 2019 store count in the U.S. to be over 4800, with average square footage per store of 147k and revenue per square foot of $468, translating into $331 billion (+4% y-o-y) in domestic revenues for fiscal 2019. In addition, we also expect close to 6370 stores in international markets, with average square footage per store of 58k and revenue per square foot of $319, translating into $119 billion (+1% y-o-y) in international revenues in the same period. On similar lines, we expect Sam’s Club revenues to reach $58 billion (-2% y-o-y) in fiscal 2019, with 599 Sam’s Club stores, 134k square footage per store and $724 of revenue per square foot. We expect a decline here on the account of the closing of 63 Sam’s Club locations.
Our forecasts for the year are summarized in our dashboard for Walmart. If you have a different view, you can modify various inputs to see how updated inputs impact the company’s valuation. You can also share the links to scenarios created on our platform.
What’s behind Trefis? See How it’s Powering New Collaboration and What-Ifs
For CFOs and Finance Teams | Product, R&D, and Marketing Teams
Like our charts? Explore example interactive dashboards and create your own.