How Is Wal-Mart Likely To Grow In The Next 2 Years?

Wal-Mart (NYSE:WMT) had a fairly strong fiscal 2018 (ending January 2018) as the company’s performance was mostly above its guidance and market expectations. In fiscal 2018, the retailer’s total revenue increased 3% year-over-year (y-o-y) to $500 billion, driven by 3% y-o-y growth in the U.S. business. Wal-Mart’s net growth was positively impacted by a 3% increase in overall comparable sales and the e-commerce business.
Accordingly, we expect Wal-Mart’s revenue to grow by nearly $22 billion (2% CAGR) through fiscal 2020. To arrive at our fiscal 2020 net revenue estimates for Wal-Mart, we have broken down the revenues and estimated separately. We have also created an interactive dashboard analysis which provides a detailed analysis of how to arrive at this growth number. You can make changes to these variables to arrive at your own revenues estimates for the company. We have a $94 price estimate for Wal-Mart, which is almost 10% ahead of the current market price.

- Where Is Walmart Stock Headed Post Stock Split?
- Up 7% Already This Year , Where Is Walmart Stock Headed Post Q4 Results?
- Up 18% This Year, Will Walmart Stock Continue To Grow Past Q3?
- Can Walmart’s Stock Trade Lower Post Q2?
- Walmart Stock Likely To See Little Movement Post Q1
- Walmart Stock To Trade Lower Post Q3 Results?
Wal-Mart’s assortment of online products has grown to nearly 75 million SKUs from a mere 2 million SKUs in 2015. Wal-Mart’s growth has been boosted by the company’s acquisitions – Jet.com, Hayneedle, Moosejaw, Shoebuy, and Bonobos – which have provided the company with a diverse product portfolio in categories like shoes and apparel, along with increased digital marketing expertise, eventually helping it face growing competition from internet retailers. So far this year, Wal-Mart has been rumored to be in talks to buy insurer Humana and pharmacy delivery startup PillPack – if these materialize, they could boost the company’s performance even further. Wal-Mart also recently announced that it would pay $16 billion to acquire a 77% stake in Flipkart, India’s biggest online retail company, to make further inroads into the fast-growing market. This deal is believed to be the world’s biggest e-commerce deal, as well as the largest for the U.S. retailer. To add to that, the retailer is planning to expand its online grocery program through its Postmates deal, whereby more than 40% of U.S. households will be covered by the expansion. Overall, the company is preparing to focus on North American core and key growth markets, in addition to China and India, going forward.
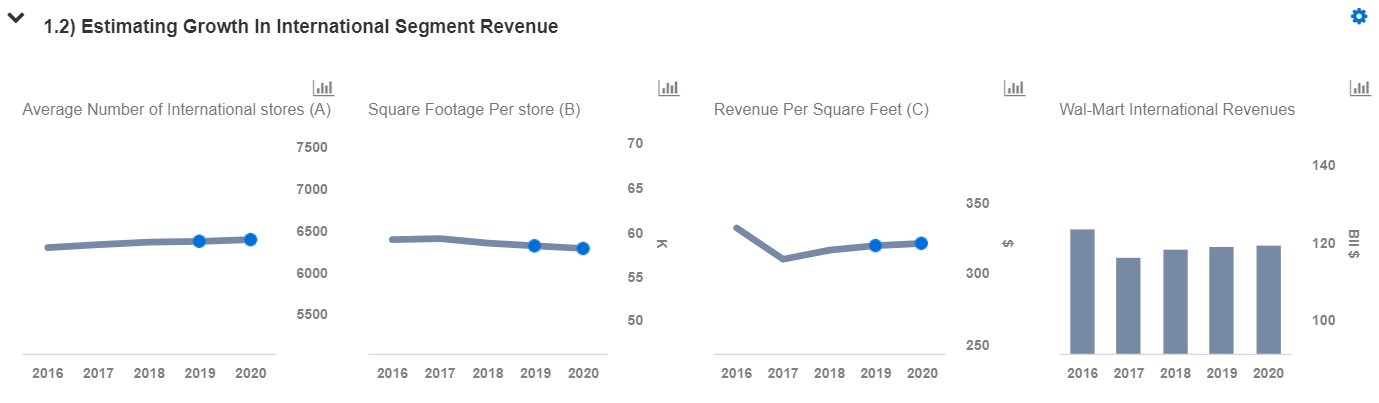
We have calculated Wal-Mart’s total revenue in 2018 by estimating the revenues from the company’s domestic sales, international sales, Sam’s club sales and other income. Further, we have calculated the retailer’s divisional revenues by estimating the number of stores, square footage per store and revenue per square feet. We expect Wal-Mart’s fiscal 2019 store count in the U.S. to be over 4800, with an average square footage per store of 147k and revenue per square feet of $466, translating into $330 billion (+3% y-o-y) in domestic revenues in fiscal 2019. We expect a similar rate of growth in store count, square footage per store and revenue per square feet in fiscal 2020, and estimate Wal-Mart’s domestic revenues to reach $340 billion. In addition, we also expect close to 6390 stores in international markets with an average square footage per store of 58k and revenue per square feet of $321, translating into $119 billion (+1% y-o-y) in international revenues in fiscal 2020. On similar lines, we expect Sam’s Club revenues to reach $58 billion (-2% y-o-y) in fiscal 2019, with 599 Sam’s Club stores, 134k square footage per store and $724 of revenue per square feet. We expect a decline here on the account of the closing of 63 Sam’s Club locations.


What’s behind Trefis? See How It’s Powering New Collaboration and What-Ifs
For CFOs and Finance Teams | Product, R&D, and Marketing Teams
Like our charts? Explore example interactive dashboards and create your own.